STEM shortage debunked
Published, 2018-05-05, Last modified, 2018-08-19

Unemployment statistics are not indication of availability.
If a new college graduate's last (or current) job was as a barista, the Bureau of Labor Statistics counts that person as an unemployed barista, even if that person holds a Ph.D in a STEM discipline. This is also true if a seasoned veteran is displaced by a temporary foreign worker and has had to take a job outside of STEM to survive. The worker's last job determines the occupational classification, regardless to qualifications.
The Bureau of Labor Statistics (BLS), Occupational Employment Statistics (OES), provides STEM employment data-sets. Subtracting the 2016 employment levels (8,775,180), from the 2017 employment levels (8,893,920), we arrive at employment growth of 118,740 in STEM occupations for 2017.[1]
The Bureau of Labor Statistics does not differentiate occupational data by citizenship status; therefore, employment growth resultant from temporary foreign workers is included in the BLS aggregate totals.
Contents
Science Technology Engineering Math (STEM)
The Bureau of Labor Statics (BLS) STEM definition includes occupations in Science, Technology, Engineering, Math and Computer, and related occupations in Management, Postsecondary teachers and Sales.
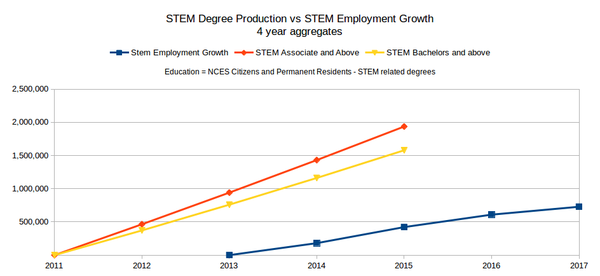 US STEM Degree Production vs. STEM Employment Growth:
Academic Discipline, 2-digit Classification of Instructional Program (CIP): 04 Architecture and Related Services, 11 Computer and Information Sciences and Support Services, 14 Engineering, 15 Engineering Technologies and Engineering Related Fields, 25 Library Science, 26 Biological and Biomedical Sciences, 27 Mathematics and Statistics, 40 Physical Sciences, 41 Science Technologies/Technicians

Bureau of Labor Statistics STEM Employment
STEM Degree production: Citizens and Permanent ResidentsYear Total Employment Employment Growth Bachelors Degrees Associate Degrees 2013 8,165,520 N/A 325,065 101,473 2014 8,345,870 180,350 341,762 99,473 2015 8,587,580 241,710 356,267 100,429 2016 8,775,180 187,600 N/A N/A 2017 8,893,920 118,740 N/A N/A Averages 182,100 341,031 100,458 See Degree production -- BLS Definitions section for CIP definitions.
- STEM employment growth/loss by NAICS Industry[1]
Bureau of Labor Statistics STEM Employment Growth/Loss 2017
by NAICS IndustryNAICS Description 2017 21 Mining, Quarrying, and Oil and Gas Extraction -14,170 61 Educational Services -4,840 42 Wholesale Trade -4,010 56 Administrative and Support and Waste Management and Remediation Services -2,560 44-45 Retail Trade -2,250 72 Accommodation and Food Services 550 71 Arts, Entertainment, and Recreation 650 11 Agriculture, Forestry, Fishing and Hunting 670 22 Utilities 850 48-49 Transportation and Warehousing 2,090 53 Real Estate and Rental and Leasing 2,600 81 Other Services (except Public Administration) 4,210 99 Federal, State, and Local Government, excluding state and local schools and hospitals and the U.S. Postal Service (OES Designation) 5,850 23 Construction 8,280 55 Management of Companies and Enterprises 12,500 31-33 Manufacturing 16,160 62 Health Care and Social Assistance 16,890 52 Finance and Insurance 19,800 51 Information 27,190 54 Professional, Scientific, and Technical Services 28,250 Employment growth = 118,710
- STEM (SOC) occupations.[1]
Bureau of Labor Statistics STEM Standard Occupational Titles (SOC) OCC_CODE OCC_TITLE 11-3021 Computer and Information Systems Managers 11-9041 Architectural and Engineering Managers 11-9121 Natural Sciences Managers 15-1111 Computer and Information Research Scientists 15-1121 Computer Systems Analysts 15-1122 Information Security Analysts 15-1131 Computer Programmers 15-1132 Software Developers, Applications 15-1133 Software Developers, Systems Software 15-1134 Web Developers 15-1141 Database Administrators 15-1142 Network and Computer Systems Administrators 15-1143 Computer Network Architects 15-1151 Computer User Support Specialists 15-1152 Computer Network Support Specialists 15-1199 Computer Occupations, All Other 15-2011 Actuaries 15-2021 Mathematicians 15-2031 Operations Research Analysts 15-2041 Statisticians 15-2090 Miscellaneous Mathematical Science Occupations 17-1011 Architects, Except Landscape and Naval 17-1012 Landscape Architects 17-1021 Cartographers and Photogrammetrists 17-1022 Surveyors 17-2011 Aerospace Engineers 17-2021 Agricultural Engineers 17-2031 Biomedical Engineers 17-2041 Chemical Engineers 17-2051 Civil Engineers 17-2061 Computer Hardware Engineers 17-2071 Electrical Engineers 17-2072 Electronics Engineers, Except Computer 17-2081 Environmental Engineers 17-2111 Health and Safety Engineers, Except Mining Safety Engineers and Inspectors 17-2112 Industrial Engineers 17-2121 Marine Engineers and Naval Architects 17-2131 Materials Engineers 17-2141 Mechanical Engineers 17-2151 Mining and Geological Engineers, Including Mining Safety Engineers 17-2161 Nuclear Engineers 17-2171 Petroleum Engineers 17-2199 Engineers, All Other 17-3011 Architectural and Civil Drafters 17-3012 Electrical and Electronics Drafters 17-3013 Mechanical Drafters 17-3019 Drafters, All Other 17-3021 Aerospace Engineering and Operations Technicians 17-3022 Civil Engineering Technicians 17-3023 Electrical and Electronics Engineering Technicians 17-3024 Electro-Mechanical Technicians 17-3025 Environmental Engineering Technicians 17-3026 Industrial Engineering Technicians 17-3027 Mechanical Engineering Technicians 17-3029 Engineering Technicians, Except Drafters, All Other 17-3031 Surveying and Mapping Technicians 19-1011 Animal Scientists 19-1012 Food Scientists and Technologists 19-1013 Soil and Plant Scientists 19-1021 Biochemists and Biophysicists 19-1022 Microbiologists 19-1023 Zoologists and Wildlife Biologists 19-1029 Biological Scientists, All Other 19-1031 Conservation Scientists 19-1032 Foresters 19-1041 Epidemiologists 19-1042 Medical Scientists, Except Epidemiologists 19-1099 Life Scientists, All Other 19-2011 Astronomers 19-2012 Physicists 19-2021 Atmospheric and Space Scientists 19-2031 Chemists 19-2032 Materials Scientists 19-2041 Environmental Scientists and Specialists, Including Health 19-2042 Geoscientists, Except Hydrologists and Geographers 19-2043 Hydrologists 19-2099 Physical Scientists, All Other 19-4011 Agricultural and Food Science Technicians 19-4021 Biological Technicians 19-4031 Chemical Technicians 19-4041 Geological and Petroleum Technicians 19-4051 Nuclear Technicians 19-4091 Environmental Science and Protection Technicians, Including Health 19-4092 Forensic Science Technicians 19-4093 Forest and Conservation Technicians 19-4099 Life, Physical, and Social Science Technicians, All Other 25-1021 Computer Science Teachers, Postsecondary 25-1022 Mathematical Science Teachers, Postsecondary 25-1031 Architecture Teachers, Postsecondary 25-1032 Engineering Teachers, Postsecondary 25-1041 Agricultural Sciences Teachers, Postsecondary 25-1042 Biological Science Teachers, Postsecondary 25-1043 Forestry and Conservation Science Teachers, Postsecondary 25-1051 Atmospheric, Earth, Marine, and Space Sciences Teachers, Postsecondary 25-1052 Chemistry Teachers, Postsecondary 25-1053 Environmental Science Teachers, Postsecondary 25-1054 Physics Teachers, Postsecondary 41-4011 Sales Representatives, Wholesale and Manufacturing, Technical and Scientific Products 41-9031 Sales Engineers
Classification of Instructional Programs
The following tables list the NCES Classification of Instructional Programs (CIP). These details were extracted from the NCES published SOC to CIP crosswalk for 2010.[3]
- In the following tables, there is some overlap of CIPs; for instance, a Computer Science CIP, may also be listed within management or postsecondary teaching occupations.
Science (SOC): Classification of Instructional Program (CIP) - 197 titles CIP_CODE CIP_TITLE 01.0000 Agriculture, General. 01.0308 Agroecology and Sustainable Agriculture. 01.0309 Viticulture and Enology. 01.0701 International Agriculture. 01.0901 Animal Sciences, General. 01.0902 Agricultural Animal Breeding. 01.0903 Animal Health. 01.0904 Animal Nutrition. 01.0905 Dairy Science. 01.0907 Poultry Science. 01.0999 Animal Sciences, Other. 01.1001 Food Science. 01.1002 Food Technology and Processing. 01.1002 Food Technology and Processing. 01.1101 Plant Sciences, General. 01.1102 Agronomy and Crop Science. 01.1103 Horticultural Science. 01.1104 Agricultural and Horticultural Plant Breeding. 01.1105 Plant Protection and Integrated Pest Management. 01.1106 Range Science and Management. 01.1199 Plant Sciences, Other. 01.1201 Soil Science and Agronomy, General. 01.1202 Soil Chemistry and Physics. 01.1203 Soil Microbiology. 01.1299 Soil Sciences, Other. 03.0101 Natural Resources/Conservation, General. 03.0103 Environmental Studies. 03.0104 Environmental Science. 03.0201 Natural Resources Management and Policy. 03.0205 Water, Wetlands, and Marine Resources Management. 03.0206 Land Use Planning and Management/Development. 03.0501 Forestry, General. 03.0502 Forest Sciences and Biology. 03.0506 Forest Management/Forest Resources Management. 03.0508 Urban Forestry. 03.0509 Wood Science and Wood Products/Pulp and Paper Technology. 03.0510 Forest Resources Production and Management. 03.0511 Forest Technology/Technician. 03.0599 Forestry, Other. 03.0601 Wildlife, Fish and Wildlands Science and Management. 12.0509 Culinary Science/Culinology. 14.1201 Engineering Physics/Applied Physics. 15.0903 Petroleum Technology/Technician. 15.0999 Mining and Petroleum Technologies/Technicians, Other. 15.1401 Nuclear Engineering Technology/Technician. 26.0101 Biology/Biological Sciences, General. 26.0102 Biomedical Sciences, General. 26.0202 Biochemistry. 26.0203 Biophysics. 26.0204 Molecular Biology. 26.0205 Molecular Biochemistry. 26.0206 Molecular Biophysics. 26.0207 Structural Biology. 26.0208 Photobiology. 26.0209 Radiation Biology/Radiobiology. 26.0210 Biochemistry and Molecular Biology. 26.0301 Botany/Plant Biology. 26.0305 Plant Pathology/Phytopathology. 26.0307 Plant Physiology. 26.0308 Plant Molecular Biology. 26.0399 Botany/Plant Biology, Other. 26.0401 Cell/Cellular Biology and Histology. 26.0403 Anatomy. 26.0404 Developmental Biology and Embryology. 26.0406 Cell/Cellular and Molecular Biology. 26.0407 Cell Biology and Anatomy. 26.0499 Cell/Cellular Biology and Anatomical Sciences, Other. 26.0502 Microbiology, General. 26.0503 Medical Microbiology and Bacteriology. 26.0504 Virology. 26.0505 Parasitology. 26.0506 Mycology. 26.0507 Immunology. 26.0508 Microbiology and Immunology. 26.0701 Zoology/Animal Biology. 26.0702 Entomology. 26.0707 Animal Physiology. 26.0708 Animal Behavior and Ethology. 26.0709 Wildlife Biology. 26.0799 Zoology/Animal Biology, Other. 26.0801 Genetics, General. 26.0802 Molecular Genetics. 26.0803 Microbial and Eukaryotic Genetics. 26.0804 Animal Genetics. 26.0805 Plant Genetics. 26.0806 Human/Medical Genetics. 26.0807 Genome Sciences/Genomics. 26.0899 Genetics, Other. 26.0901 Physiology, General. 26.0902 Molecular Physiology. 26.0903 Cell Physiology. 26.0904 Endocrinology. 26.0905 Reproductive Biology. 26.0907 Cardiovascular Science. 26.0908 Exercise Physiology. 26.0909 Vision Science/Physiological Optics. 26.0910 Pathology/Experimental Pathology. 26.0911 Oncology and Cancer Biology. 26.0912 Aerospace Physiology and Medicine. 26.0999 Physiology, Pathology, and Related Sciences, Other. 26.1001 Pharmacology. 26.1002 Molecular Pharmacology. 26.1003 Neuropharmacology. 26.1004 Toxicology. 26.1005 Molecular Toxicology. 26.1006 Environmental Toxicology. 26.1007 Pharmacology and Toxicology. 26.1099 Pharmacology and Toxicology, Other. 26.1101 Biometry/Biometrics. 26.1102 Biostatistics. 26.1104 Computational Biology. 26.1199 Biomathematics, Bioinformatics, and Computational Biology, Other. 26.1201 Biotechnology. 26.1301 Ecology. 26.1302 Marine Biology and Biological Oceanography. 26.1303 Evolutionary Biology. 26.1304 Aquatic Biology/Limnology. 26.1305 Environmental Biology. 26.1306 Population Biology. 26.1307 Conservation Biology. 26.1308 Systematic Biology/Biological Systematics. 26.1309 Epidemiology. 26.1310 Ecology and Evolutionary Biology. 26.1399 Ecology, Evolution, Systematics and Population Biology, Other. 26.1401 Molecular Medicine. 26.1501 Neuroscience. 26.1502 Neuroanatomy. 26.1503 Neurobiology and Anatomy. 26.1504 Neurobiology and Behavior. 26.1599 Neurobiology and Neurosciences, Other. 26.9999 Biological and Biomedical Sciences, Other. 27.0306 Mathematical Biology. 30.1101 Gerontology. 30.1701 Behavioral Sciences. 30.1801 Natural Sciences. 30.1901 Nutrition Sciences. 30.2701 Human Biology. 30.3201 Marine Sciences. 40.0201 Astronomy. 40.0202 Astrophysics. 40.0203 Planetary Astronomy and Science. 40.0299 Astronomy and Astrophysics, Other. 40.0401 Atmospheric Sciences and Meteorology, General. 40.0402 Atmospheric Chemistry and Climatology. 40.0403 Atmospheric Physics and Dynamics. 40.0404 Meteorology. 40.0499 Atmospheric Sciences and Meteorology, Other. 40.0501 Chemistry, General. 40.0502 Analytical Chemistry. 40.0503 Inorganic Chemistry. 40.0504 Organic Chemistry. 40.0506 Physical Chemistry. 40.0507 Polymer Chemistry. 40.0508 Chemical Physics. 40.0509 Environmental Chemistry. 40.0510 Forensic Chemistry. 40.0511 Theoretical Chemistry. 40.0599 Chemistry, Other. 40.0601 Geology/Earth Science, General. 40.0602 Geochemistry. 40.0603 Geophysics and Seismology. 40.0604 Paleontology. 40.0605 Hydrology and Water Resources Science. 40.0606 Geochemistry and Petrology. 40.0607 Oceanography, Chemical and Physical. 40.0699 Geological and Earth Sciences/Geosciences, Other. 40.0801 Physics, General. 40.0802 Atomic/Molecular Physics. 40.0804 Elementary Particle Physics. 40.0805 Plasma and High-Temperature Physics. 40.0806 Nuclear Physics. 40.0807 Optics/Optical Sciences. 40.0808 Condensed Matter and Materials Physics. 40.0809 Acoustics. 40.0810 Theoretical and Mathematical Physics. 40.0899 Physics, Other. 40.1001 Materials Science. 40.1002 Materials Chemistry. 40.1099 Materials Sciences, Other. 40.9999 Physical Sciences, Other. 41.0000 Science Technologies/Technicians, General. 41.0101 Biology Technician/Biotechnology Laboratory Technician. 41.0204 Industrial Radiologic Technology/Technician. 41.0205 Nuclear/Nuclear Power Technology/Technician. 41.0299 Nuclear and Industrial Radiologic Technologies/Technicians, Other. 41.0301 Chemical Technology/Technician. 41.0303 Chemical Process Technology. 41.0399 Physical Science Technologies/Technicians, Other. 41.9999 Science Technologies/Technicians, Other. 43.0106 Forensic Science and Technology. 45.0101 Social Sciences, General. 51.0916 Radiation Protection/Health Physics Technician. 51.1401 Medical Scientist. 51.2010 Pharmaceutical Sciences. 51.2202 Environmental Health. 51.2205 Health/Medical Physics. 51.2314 Rehabilitation Science.
Engineers (SOC): Classification of Instructional Program (CIP) - 103 titles CIP_CODE CIP_TITLE 14.0201 Aerospace, Aeronautical and Astronautical/Space Engineering. 04.0901 Architectural Technology/Technician. 04.0902 Architectural and Building Sciences/Technology. 04.0999 Architectural Sciences and Technology, Other. 14.0101 Engineering, General. 14.0301 Agricultural Engineering. 14.0401 Architectural Engineering. 14.0501 Bioengineering and Biomedical Engineering. 14.0601 Ceramic Sciences and Engineering. 14.0701 Chemical Engineering. 14.0702 Chemical and Biomolecular Engineering. 14.0799 Chemical Engineering, Other. 14.0801 Civil Engineering, General. 14.0802 Geotechnical and Geoenvironmental Engineering. 14.0803 Structural Engineering. 14.0804 Transportation and Highway Engineering. 14.0805 Water Resources Engineering. 14.0899 Civil Engineering, Other. 14.0901 Computer Engineering, General. 14.0902 Computer Hardware Engineering. 14.1001 Electrical and Electronics Engineering 14.1003 Laser and Optical Engineering. 14.1004 Telecommunications Engineering. 14.1099 Electrical, Electronics and Communications Engineering, Other. 14.1101 Engineering Mechanics. 14.1201 Engineering Physics/Applied Physics. 14.1301 Engineering Science. 14.1401 Environmental/Environmental Health Engineering. 14.1801 Materials Engineering. 14.1901 Mechanical Engineering. 14.2001 Metallurgical Engineering. 14.2101 Mining and Mineral Engineering. 14.2201 Naval Architecture and Marine Engineering. 14.2301 Nuclear Engineering. 14.2401 Ocean Engineering. 14.2501 Petroleum Engineering. 14.2701 Systems Engineering. 14.2801 Textile Sciences and Engineering. 14.3201 Polymer/Plastics Engineering. 14.3301 Construction Engineering. 14.3401 Forest Engineering. 14.3501 Industrial Engineering. 14.3601 Manufacturing Engineering. 14.3801 Surveying Engineering. 14.3901 Geological/Geophysical Engineering. 14.4001 Paper Science and Engineering. 14.4101 Electromechanical Engineering. 14.4101 Electromechanical Engineering. 14.4201 Mechatronics, Robotics, and Automation Engineering. 14.4301 Biochemical Engineering. 14.4401 Engineering Chemistry. 14.4501 Biological/Biosystems Engineering. 14.9999 Engineering, Other. 15.0101 Architectural Engineering Technology/Technician. 15.0201 Civil Engineering Technology/Technician. 15.0303 Electrical, Electronic and Communications Engineering Technology/Technician. 15.0304 Laser and Optical Technology/Technician. 15.0305 Telecommunications Technology/Technician. 15.0306 Integrated Circuit Design. 15.0399 Electrical and Electronic Engineering Technologies/Technicians, Other. 15.0401 Biomedical Technology/Technician. 15.0403 Electromechanical Technology/Electromechanical Engineering Technology. 15.0404 Instrumentation Technology/Technician. 15.0405 Robotics Technology/Technician. 15.0406 Automation Engineer Technology/Technician. 15.0499 Electromechanical and Instrumentation and Maintenance Technologies/Technicians, Other. 15.0501 Heating, Ventilation, Air Conditioning and Refrigeration Engineering Technology/Technician. 15.0503 Energy Management and Systems Technology/Technician. 15.0505 Solar Energy Technology/Technician. 15.0507 Environmental Engineering Technology/Environmental Technology. 15.0599 Environmental Control Technologies/Technicians, Other. 15.0607 Plastics and Polymer Engineering Technology/Technician. 15.0611 Metallurgical Technology/Technician. 15.0612 Industrial Technology/Technician. 15.0613 Manufacturing Engineering Technology/Technician. 15.0614 Welding Engineering Technology/Technician. 15.0615 Chemical Engineering Technology/Technician. 15.0616 Semiconductor Manufacturing Technology. 15.0699 Industrial Production Technologies/Technicians, Other. 15.0704 Hazardous Materials Information Systems Technology/Technician. 15.0801 Aeronautical/Aerospace Engineering Technology/Technician. 15.0805 Mechanical Engineering/Mechanical Technology/Technician. 15.0899 Mechanical Engineering Related Technologies/Technicians, Other. 15.0901 Mining Technology/Technician. 15.1001 Construction Engineering Technology/Technician. 15.1102 Surveying Technology/Surveying. 15.1103 Hydraulics and Fluid Power Technology/Technician. 15.1201 Computer Engineering Technology/Technician. 15.1202 Computer Technology/Computer Systems Technology. 15.1203 Computer Hardware Technology/Technician. 15.1301 Drafting and Design Technology/Technician, General. 15.1302 CAD/CADD Drafting and/or Design Technology/Technician. 15.1303 Architectural Drafting and Architectural CAD/CADD. 15.1304 Civil Drafting and Civil Engineering CAD/CADD. 15.1305 Electrical/Electronics Drafting and Electrical/Electronics CAD/CADD. 15.1306 Mechanical Drafting and Mechanical Drafting CAD/CADD. 15.1399 Drafting/Design Engineering Technologies/Technicians, Other. 15.1501 Engineering/Industrial Management. 15.1502 Engineering Design. 15.1503 Packaging Science. 15.1601 Nanotechnology. 41.0303 Chemical Process Technology. 46.0415 Building Construction Technology. 51.2312 Assistive/Augmentative Technology and Rehabilitation Engineering.
Math (SOC): Classification of Instructional Program (CIP) - 26 titles CIP_CODE CIP_TITLE 14.3701 Operations Research. 26.1102 Biostatistics. 26.1104 Computational Biology. 27.0101 Mathematics, General. 27.0102 Algebra and Number Theory. 27.0103 Analysis and Functional Analysis. 27.0104 Geometry/Geometric Analysis. 27.0105 Topology and Foundations. 27.0199 Mathematics, Other. 27.0301 Applied Mathematics, General. 27.0303 Computational Mathematics. 27.0304 Computational and Applied Mathematics. 27.0305 Financial Mathematics. 27.0306 Mathematical Biology. 27.0399 Applied Mathematics, Other. 27.0501 Statistics, General. 27.0502 Mathematical Statistics and Probability. 27.0503 Mathematics and Statistics. 27.0599 Statistics, Other. 27.9999 Mathematics and Statistics, Other. 30.3001 Computational Science. 38.0102 Logic. 45.0102 Research Methodology and Quantitative Methods. 52.1301 Management Science. 52.1302 Business Statistics. 52.1304 Actuarial Science.
Computer (SOC): Classification of Instructional Program (CIP) - 38 titles CIP_CODE CIP_TITLE 01.0106 Agricultural Business Technology. 11.0101 Computer and Information Sciences, General. 11.0102 Artificial Intelligence. 11.0103 Information Technology. 11.0104 Informatics. 11.0199 Computer and Information Sciences, Other. 11.0201 Computer Programming/Programmer, General. 11.0202 Computer Programming, Specific Applications. 11.0203 Computer Programming, Vendor/Product Certification. 11.0299 Computer Programming, Other. 11.0301 Data Processing and Data Processing Technology/Technician. 11.0401 Information Science/Studies. 11.0501 Computer Systems Analysis/Analyst. 11.0701 Computer Science. 11.0801 Web Page, Digital/Multimedia and Information Resources Design. 11.0802 Data Modeling/Warehousing and Database Administration. 11.0803 Computer Graphics. 11.0804 Modeling, Virtual Environments and Simulation. 11.0901 Computer Systems Networking and Telecommunications. 11.1001 Network and System Administration/Administrator. 11.1002 System, Networking, and LAN/WAN Management/Manager. 11.1003 Computer and Information Systems Security/Information Assurance. 11.1004 Web/Multimedia Management and Webmaster. 11.1005 Information Technology Project Management. 11.1006 Computer Support Specialist. 14.0901 Computer Engineering, General. 14.0999 Computer Engineering, Other. 15.1204 Computer Software Technology/Technician. 26.1103 Bioinformatics. 26.1104 Computational Biology. 30.0801 Mathematics and Computer Science. 30.1601 Accounting and Computer Science. 30.3001 Computational Science. 30.3101 Human Computer Interaction. 43.0116 Cyber/Computer Forensics and Counterterrorism. 51.0709 Medical Office Computer Specialist/Assistant. 51.2706 Medical Informatics. 52.1201 Management Information Systems, General.
Postsecondary teachers (SOC): Classification of Instructional Program (CIP) - 276 titles CIP_CODE CIP_TITLE 13.1303 Business Teacher Education. 01.0000 Agriculture, General. 01.0101 Agricultural Business and Management, General. 01.0102 Agribusiness/Agricultural Business Operations. 01.0103 Agricultural Economics. 01.0104 Farm/Farm and Ranch Management. 01.0105 Agricultural/Farm Supplies Retailing and Wholesaling. 01.0199 Agricultural Business and Management, Other. 01.0201 Agricultural Mechanization, General. 01.0204 Agricultural Power Machinery Operation. 01.0299 Agricultural Mechanization, Other. 01.0301 Agricultural Production Operations, General. 01.0302 Animal/Livestock Husbandry and Production. 01.0303 Aquaculture. 01.0304 Crop Production. 01.0308 Agroecology and Sustainable Agriculture. 01.0309 Viticulture and Enology. 01.0399 Agricultural Production Operations, Other. 01.0401 Agricultural and Food Products Processing. 01.0505 Animal Training. 01.0507 Equestrian/Equine Studies. 01.0601 Applied Horticulture/Horticulture Operations, General. 01.0603 Ornamental Horticulture. 01.0604 Greenhouse Operations and Management. 01.0605 Landscaping and Groundskeeping. 01.0606 Plant Nursery Operations and Management. 01.0607 Turf and Turfgrass Management. 01.0701 International Agriculture. 01.0901 Animal Sciences, General. 01.0902 Agricultural Animal Breeding. 01.0903 Animal Health. 01.0904 Animal Nutrition. 01.0905 Dairy Science. 01.0906 Livestock Management. 01.0907 Poultry Science. 01.0999 Animal Sciences, Other. 01.1001 Food Science. 01.1101 Plant Sciences, General. 01.1102 Agronomy and Crop Science. 01.1103 Horticultural Science. 01.1104 Agricultural and Horticultural Plant Breeding. 01.1105 Plant Protection and Integrated Pest Management. 01.1106 Range Science and Management. 01.1106 Range Science and Management. 01.1199 Plant Sciences, Other. 01.1201 Soil Science and Agronomy, General. 01.1299 Soil Sciences, Other. 03.0101 Natural Resources/Conservation, General. 03.0103 Environmental Studies. 03.0104 Environmental Science. 03.0201 Natural Resources Management and Policy. 03.0205 Water, Wetlands, and Marine Resources Management. 03.0206 Land Use Planning and Management/Development. 03.0299 Natural Resources Management and Policy, Other. 03.0501 Forestry, General. 03.0502 Forest Sciences and Biology. 03.0506 Forest Management/Forest Resources Management. 03.0508 Urban Forestry. 03.0509 Wood Science and Wood Products/Pulp and Paper Technology. 03.0510 Forest Resources Production and Management. 03.0599 Forestry, Other. 03.0601 Wildlife, Fish and Wildlands Science and Management. 03.9999 Natural Resources and Conservation, Other. 04.0201 Architecture. 04.0301 City/Urban, Community and Regional Planning. 04.0401 Environmental Design/Architecture. 04.0501 Interior Architecture. 04.0601 Landscape Architecture. 04.0902 Architectural and Building Sciences/Technology. 04.0999 Architectural Sciences and Technology, Other. 11.0101 Computer and Information Sciences, General. 11.0201 Computer Programming/Programmer, General. 11.0401 Information Science/Studies. 11.0501 Computer Systems Analysis/Analyst. 11.0701 Computer Science. 13.1301 Agricultural Teacher Education. 13.1310 Sales and Marketing Operations/Marketing and Distribution Teacher Education. 13.1311 Mathematics Teacher Education. 13.1316 Science Teacher Education/General Science Teacher Education. 13.1321 Computer Teacher Education. 13.1322 Biology Teacher Education. 13.1323 Chemistry Teacher Education. 13.1329 Physics Teacher Education. 13.1337 Earth Science Teacher Education. 14.0101 Engineering, General. 14.0201 Aerospace, Aeronautical and Astronautical/Space Engineering. 14.0301 Agricultural Engineering. 14.0401 Architectural Engineering. 14.0501 Bioengineering and Biomedical Engineering. 14.0601 Ceramic Sciences and Engineering. 14.0701 Chemical Engineering. 14.0702 Chemical and Biomolecular Engineering. 14.0799 Chemical Engineering, Other. 14.0801 Civil Engineering, General. 14.0802 Geotechnical and Geoenvironmental Engineering. 14.0803 Structural Engineering. 14.0804 Transportation and Highway Engineering. 14.0805 Water Resources Engineering. 14.0899 Civil Engineering, Other. 14.0901 Computer Engineering, General. 14.0902 Computer Hardware Engineering. 14.0903 Computer Software Engineering. 14.0999 Computer Engineering, Other. 14.1001 Electrical and Electronics Engineering 14.1003 Laser and Optical Engineering. 14.1004 Telecommunications Engineering. 14.1099 Electrical, Electronics and Communications Engineering, Other. 14.1101 Engineering Mechanics. 14.1201 Engineering Physics/Applied Physics. 14.1301 Engineering Science. 14.1401 Environmental/Environmental Health Engineering. 14.1801 Materials Engineering. 14.1901 Mechanical Engineering. 14.2001 Metallurgical Engineering. 14.2101 Mining and Mineral Engineering. 14.2201 Naval Architecture and Marine Engineering. 14.2301 Nuclear Engineering. 14.2401 Ocean Engineering. 14.2501 Petroleum Engineering. 14.2701 Systems Engineering. 14.2801 Textile Sciences and Engineering. 14.3201 Polymer/Plastics Engineering. 14.3301 Construction Engineering. 14.3401 Forest Engineering. 14.3501 Industrial Engineering. 14.3601 Manufacturing Engineering. 14.3801 Surveying Engineering. 14.3901 Geological/Geophysical Engineering. 14.4001 Paper Science and Engineering. 14.4101 Electromechanical Engineering. 14.4201 Mechatronics, Robotics, and Automation Engineering. 14.4301 Biochemical Engineering. 14.4401 Engineering Chemistry. 14.4501 Biological/Biosystems Engineering. 14.9999 Engineering, Other. 15.1502 Engineering Design. 15.1503 Packaging Science. 26.0101 Biology/Biological Sciences, General. 26.0202 Biochemistry. 26.0203 Biophysics. 26.0204 Molecular Biology. 26.0209 Radiation Biology/Radiobiology. 26.0210 Biochemistry and Molecular Biology. 26.0299 Biochemistry, Biophysics and Molecular Biology, Other. 26.0301 Botany/Plant Biology. 26.0305 Plant Pathology/Phytopathology. 26.0307 Plant Physiology. 26.0399 Botany/Plant Biology, Other. 26.0401 Cell/Cellular Biology and Histology. 26.0403 Anatomy. 26.0499 Cell/Cellular Biology and Anatomical Sciences, Other. 26.0502 Microbiology, General. 26.0504 Virology. 26.0505 Parasitology. 26.0507 Immunology. 26.0508 Microbiology and Immunology. 26.0599 Microbiological Sciences and Immunology, Other. 26.0701 Zoology/Animal Biology. 26.0702 Entomology. 26.0707 Animal Physiology. 26.0799 Zoology/Animal Biology, Other. 26.0802 Molecular Genetics. 26.0805 Plant Genetics. 26.0807 Genome Sciences/Genomics. 26.0899 Genetics, Other. 26.0910 Pathology/Experimental Pathology. 26.0912 Aerospace Physiology and Medicine. 26.1001 Pharmacology. 26.1004 Toxicology. 26.1101 Biometry/Biometrics. 26.1104 Computational Biology. 26.1199 Biomathematics, Bioinformatics, and Computational Biology, Other. 26.1201 Biotechnology. 26.1301 Ecology. 26.1302 Marine Biology and Biological Oceanography. 26.1303 Evolutionary Biology. 26.1310 Ecology and Evolutionary Biology. 26.1399 Ecology, Evolution, Systematics and Population Biology, Other. 26.1401 Molecular Medicine. 26.1501 Neuroscience. 26.1502 Neuroanatomy. 26.1503 Neurobiology and Anatomy. 26.1504 Neurobiology and Behavior. 26.1599 Neurobiology and Neurosciences, Other. 26.9999 Biological and Biomedical Sciences, Other. 27.0101 Mathematics, General. 27.0102 Algebra and Number Theory. 27.0103 Analysis and Functional Analysis. 27.0104 Geometry/Geometric Analysis. 27.0105 Topology and Foundations. 27.0199 Mathematics, Other. 27.0301 Applied Mathematics, General. 27.0304 Computational and Applied Mathematics. 27.0305 Financial Mathematics. 27.0306 Mathematical Biology. 27.0399 Applied Mathematics, Other. 27.0501 Statistics, General. 27.0502 Mathematical Statistics and Probability. 27.0503 Mathematics and Statistics. 27.0599 Statistics, Other. 27.9999 Mathematics and Statistics, Other. 30.1901 Nutrition Sciences. 30.2701 Human Biology. 38.0102 Logic. 40.0201 Astronomy. 40.0202 Astrophysics. 40.0203 Planetary Astronomy and Science. 40.0299 Astronomy and Astrophysics, Other. 40.0401 Atmospheric Sciences and Meteorology, General. 40.0402 Atmospheric Chemistry and Climatology. 40.0403 Atmospheric Physics and Dynamics. 40.0404 Meteorology. 40.0499 Atmospheric Sciences and Meteorology, Other. 40.0501 Chemistry, General. 40.0502 Analytical Chemistry. 40.0503 Inorganic Chemistry. 40.0504 Organic Chemistry. 40.0506 Physical Chemistry. 40.0507 Polymer Chemistry. 40.0508 Chemical Physics. 40.0509 Environmental Chemistry. 40.0510 Forensic Chemistry. 40.0511 Theoretical Chemistry. 40.0599 Chemistry, Other. 40.0601 Geology/Earth Science, General. 40.0602 Geochemistry. 40.0603 Geophysics and Seismology. 40.0604 Paleontology. 40.0605 Hydrology and Water Resources Science. 40.0606 Geochemistry and Petrology. 40.0607 Oceanography, Chemical and Physical. 40.0699 Geological and Earth Sciences/Geosciences, Other. 40.0801 Physics, General. 40.0802 Atomic/Molecular Physics. 40.0804 Elementary Particle Physics. 40.0805 Plasma and High-Temperature Physics. 40.0806 Nuclear Physics. 40.0807 Optics/Optical Sciences. 40.0808 Condensed Matter and Materials Physics. 40.0809 Acoustics. 40.0810 Theoretical and Mathematical Physics. 40.0899 Physics, Other. 40.1001 Materials Science. 40.1002 Materials Chemistry. 50.0408 Interior Design. 52.0101 Business/Commerce, General. 52.0201 Business Administration and Management, General. 52.0202 Purchasing, Procurement/Acquisitions and Contracts Management. 52.0203 Logistics, Materials, and Supply Chain Management. 52.0205 Operations Management and Supervision. 52.0210 Research and Development Management. 52.0211 Project Management. 52.0212 Retail Management. 52.0213 Organizational Leadership. 52.0301 Accounting. 52.0501 Business/Corporate Communications. 52.0701 Entrepreneurship/Entrepreneurial Studies. 52.0702 Franchising and Franchise Operations. 52.0801 Finance, General. 52.0804 Financial Planning and Services. 52.0806 International Finance. 52.0807 Investments and Securities. 52.0808 Public Finance. 52.0909 Hotel, Motel, and Restaurant Management. 52.1001 Human Resources Management/Personnel Administration, General. 52.1002 Labor and Industrial Relations. 52.1003 Organizational Behavior Studies. 52.1101 International Business/Trade/Commerce. 52.1301 Management Science. 52.1302 Business Statistics. 52.1304 Actuarial Science. 52.1401 Marketing/Marketing Management, General. 52.1402 Marketing Research. 52.1403 International Marketing. 52.1701 Insurance. 52.2101 Telecommunications Management.
Sales (SOC): Classification of Instructional Program (CIP) - 1 title CIP_CODE CIP_TITLE 52.1804 Selling Skills and Sales Operations.
Managers (SOC): Classification of Instructional Program (CIP) - 193 titles CIP_CODE CIP_TITLE 11.0101 Computer and Information Sciences, General. 04.0201 Architecture. 04.0301 City/Urban, Community and Regional Planning. 04.0401 Environmental Design/Architecture. 04.0501 Interior Architecture. 04.0601 Landscape Architecture. 04.0902 Architectural and Building Sciences/Technology. 11.0103 Information Technology. 11.0401 Information Science/Studies. 11.0701 Computer Science. 11.1001 Network and System Administration/Administrator. 11.1003 Computer and Information Systems Security/Information Assurance. 11.1005 Information Technology Project Management. 14.0101 Engineering, General. 14.0201 Aerospace, Aeronautical and Astronautical/Space Engineering. 14.0301 Agricultural Engineering. 14.0401 Architectural Engineering. 14.0501 Bioengineering and Biomedical Engineering. 14.0601 Ceramic Sciences and Engineering. 14.0701 Chemical Engineering. 14.0702 Chemical and Biomolecular Engineering. 14.0799 Chemical Engineering, Other. 14.0801 Civil Engineering, General. 14.0802 Geotechnical and Geoenvironmental Engineering. 14.0803 Structural Engineering. 14.0804 Transportation and Highway Engineering. 14.0805 Water Resources Engineering. 14.0899 Civil Engineering, Other. 14.0901 Computer Engineering, General. 14.0902 Computer Hardware Engineering. 14.0903 Computer Software Engineering. 14.0999 Computer Engineering, Other. 14.1001 Electrical and Electronics Engineering 14.1003 Laser and Optical Engineering. 14.1004 Telecommunications Engineering. 14.1099 Electrical, Electronics and Communications Engineering, Other. 14.1101 Engineering Mechanics. 14.1201 Engineering Physics/Applied Physics. 14.1301 Engineering Science. 14.1401 Environmental/Environmental Health Engineering. 14.1801 Materials Engineering. 14.1901 Mechanical Engineering. 14.2001 Metallurgical Engineering. 14.2101 Mining and Mineral Engineering. 14.2201 Naval Architecture and Marine Engineering. 14.2301 Nuclear Engineering. 14.2401 Ocean Engineering. 14.2501 Petroleum Engineering. 14.2701 Systems Engineering. 14.2801 Textile Sciences and Engineering. 14.3201 Polymer/Plastics Engineering. 14.3301 Construction Engineering. 14.3401 Forest Engineering. 14.3501 Industrial Engineering. 14.3601 Manufacturing Engineering. 14.3701 Operations Research. 14.3801 Surveying Engineering. 14.3901 Geological/Geophysical Engineering. 14.4001 Paper Science and Engineering. 14.4101 Electromechanical Engineering. 14.4201 Mechatronics, Robotics, and Automation Engineering. 14.4301 Biochemical Engineering. 14.4401 Engineering Chemistry. 14.4501 Biological/Biosystems Engineering. 14.9999 Engineering, Other. 15.1501 Engineering/Industrial Management. 15.1502 Engineering Design. 15.1503 Packaging Science. 26.0101 Biology/Biological Sciences, General. 26.0202 Biochemistry. 26.0203 Biophysics. 26.0204 Molecular Biology. 26.0209 Radiation Biology/Radiobiology. 26.0210 Biochemistry and Molecular Biology. 26.0299 Biochemistry, Biophysics and Molecular Biology, Other. 26.0301 Botany/Plant Biology. 26.0305 Plant Pathology/Phytopathology. 26.0307 Plant Physiology. 26.0399 Botany/Plant Biology, Other. 26.0401 Cell/Cellular Biology and Histology. 26.0403 Anatomy. 26.0499 Cell/Cellular Biology and Anatomical Sciences, Other. 26.0502 Microbiology, General. 26.0503 Medical Microbiology and Bacteriology. 26.0504 Virology. 26.0505 Parasitology. 26.0507 Immunology. 26.0508 Microbiology and Immunology. 26.0599 Microbiological Sciences and Immunology, Other. 26.0701 Zoology/Animal Biology. 26.0702 Entomology. 26.0707 Animal Physiology. 26.0799 Zoology/Animal Biology, Other. 26.0802 Molecular Genetics. 26.0804 Animal Genetics. 26.0805 Plant Genetics. 26.0807 Genome Sciences/Genomics. 26.0899 Genetics, Other. 26.0910 Pathology/Experimental Pathology. 26.0912 Aerospace Physiology and Medicine. 26.1001 Pharmacology. 26.1004 Toxicology. 26.1101 Biometry/Biometrics. 26.1102 Biostatistics. 26.1104 Computational Biology. 26.1199 Biomathematics, Bioinformatics, and Computational Biology, Other. 26.1201 Biotechnology. 26.1301 Ecology. 26.1302 Marine Biology and Biological Oceanography. 26.1303 Evolutionary Biology. 26.1310 Ecology and Evolutionary Biology. 26.1399 Ecology, Evolution, Systematics and Population Biology, Other. 26.1401 Molecular Medicine. 26.1501 Neuroscience. 26.1502 Neuroanatomy. 26.1503 Neurobiology and Anatomy. 26.1504 Neurobiology and Behavior. 26.1599 Neurobiology and Neurosciences, Other. 26.9999 Biological and Biomedical Sciences, Other. 27.0101 Mathematics, General. 27.0102 Algebra and Number Theory. 27.0103 Analysis and Functional Analysis. 27.0104 Geometry/Geometric Analysis. 27.0105 Topology and Foundations. 27.0199 Mathematics, Other. 27.0301 Applied Mathematics, General. 27.0303 Computational Mathematics. 27.0304 Computational and Applied Mathematics. 27.0305 Financial Mathematics. 27.0306 Mathematical Biology. 27.0399 Applied Mathematics, Other. 27.0501 Statistics, General. 27.0503 Mathematics and Statistics. 27.0599 Statistics, Other. 27.9999 Mathematics and Statistics, Other. 30.0101 Biological and Physical Sciences. 30.0801 Mathematics and Computer Science. 30.1001 Biopsychology. 30.1501 Science, Technology and Society. 30.1801 Natural Sciences. 30.1901 Nutrition Sciences. 30.3001 Computational Science. 30.3201 Marine Sciences. 38.0102 Logic. 40.0101 Physical Sciences. 40.0201 Astronomy. 40.0202 Astrophysics. 40.0203 Planetary Astronomy and Science. 40.0299 Astronomy and Astrophysics, Other. 40.0401 Atmospheric Sciences and Meteorology, General. 40.0402 Atmospheric Chemistry and Climatology. 40.0403 Atmospheric Physics and Dynamics. 40.0404 Meteorology. 40.0499 Atmospheric Sciences and Meteorology, Other. 40.0501 Chemistry, General. 40.0502 Analytical Chemistry. 40.0503 Inorganic Chemistry. 40.0504 Organic Chemistry. 40.0506 Physical Chemistry. 40.0507 Polymer Chemistry. 40.0508 Chemical Physics. 40.0509 Environmental Chemistry. 40.0510 Forensic Chemistry. 40.0511 Theoretical Chemistry. 40.0599 Chemistry, Other. 40.0601 Geology/Earth Science, General. 40.0602 Geochemistry. 40.0603 Geophysics and Seismology. 40.0604 Paleontology. 40.0605 Hydrology and Water Resources Science. 40.0606 Geochemistry and Petrology. 40.0607 Oceanography, Chemical and Physical. 40.0699 Geological and Earth Sciences/Geosciences, Other. 40.0801 Physics, General. 40.0802 Atomic/Molecular Physics. 40.0804 Elementary Particle Physics. 40.0805 Plasma and High-Temperature Physics. 40.0806 Nuclear Physics. 40.0807 Optics/Optical Sciences. 40.0808 Condensed Matter and Materials Physics. 40.0809 Acoustics. 40.0810 Theoretical and Mathematical Physics. 40.0899 Physics, Other. 40.1001 Materials Science. 40.1002 Materials Chemistry. 40.1099 Materials Sciences, Other. 40.9999 Physical Sciences, Other. 51.1401 Medical Scientist. 52.0205 Operations Management and Supervision. 52.0210 Research and Development Management. 52.1201 Management Information Systems, General. 52.1206 Information Resources Management. 52.1207 Knowledge Management.
- The technology instructional classifications are distributed throughout the SOC occupations -- BLS does not currently maintain a broad category for (STEM) Technology occupations.
Temporary foreign workers (methodology)
There are several temporary employment visa programs that adversely affect citizens and permanent residents in the STEM occupations, in addition, the OPT Extension (a 3 year internship for foreign students) and 144,000 employment based permanent residence visas impact employment. OPT and permanent resident visas are beyond the scope of this document.
H-1B temporary work visas
From the 2017, H-1B Characteristics report, we find that the STEM occupations alone exceed the employer lamented cap of 85,000 visas.[4]
H-1B temporary visas: 2017 Initial Employment Computer-related occupations 69,846 Occupations in Architecture, Engineering and Surveying 10,243 Occupations in Mathematics and Physical Sciences 2,786 Occupations in Life Sciences 1,533 Miscellaneous Professional, Technical and Managerial 1,622 H-1B visa total = 86,030
Effectively, H-1B foreign workers are offered the job first. The H-1B application season is the first week in April, well before US college graduation in June. If the employer pays for H-1B premium processing, USCIS can provide an confirmation or denial for the H-1B petition in as little as two weeks. Premium processing for (FY 2019) is temporarily suspended.[5]
- The H-1B candidate may not enter the US without a job; therefore, United States candidates are relegated to the left over jobs.
L-1 temporary work visas
The L-1 visa is an intra-company visa with an initial term of 3 years. Manager's (L-1A) visas can be extended another 3 years, production employee (L-1B) visas can be extended 2 years.[6] The US Department of State (DOS) publishes data on Nonimmigrant Visas Issued by Classification, but this data does not provide occupational breakdown and may include re-entries.[7]
- From the USCIS H-1B Characteristics reports, we can find the percentage initial employment authorizations issued. In terms of demand and function, L-1 temporary employment visas are virtually identical, so we will distribute the H-1B percentages to estimate the L-1 visa initial authorizations.
Estimate of visas issued vs new employment authorizations (2017) DOS H-1B visas issued 179,049 USCIS H-1B initial approvals 108,101 Percent of H-1B that are new employment authorizations 60.38%
- The Department of State issued 78,178 L-1 visas in 2017, but from our estimate above, only 60.38% of those would qualify as initial employment authorizations, where we arrive at 47,204 initial L-1 employment authorizations. From that percentage of L-1 issued visas, we distribute the same occupational breakdown as the H-1B occupations.
L-1 visas 2017 Initial employment (estimate) %H-1B L-1 Initial STEM visas
(Based on H-1B Characteristics)Computer-related occupations 62.00% 29,266 Occupations in Architecture, Engineering and Surveying 9.80% 4,626 Occupations in Mathematics and Physical Sciences 2.60% 1,227 Occupations in Life Sciences 2.10% 991 Miscellaneous Professional, Technical and Managerial 1.20% 566 L-1 STEM visa totals for 2017 77.70% 36,677
NAFTA professional (TN) visas
Similar to the L-1 visa,[8] we can obtain the NAFTA professional (TN) data for visa issued (16,119), from the Department of State.[7]
- We again extrapolate our findings from the USCIS H-1B data. After we adjust continuing authorizations, the estimate of NAFTA initial employment authorizations at 9,733, or 60.38% of the NAFTA total.
NAFTA professional visas 2017 Initial employment (estimate) %H-1B NAFTA Initial STEM visas
(Based on H-1B Characteristics)Computer-related occupations 62.00% 6,034 Occupations in Architecture, Engineering and Surveying 9.80% 954 Occupations in Mathematics and Physical Sciences 2.60% 253 Occupations in Life Sciences 2.10% 204 Miscellaneous Professional, Technical and Managerial 1.20% 117 NAFTA STEM visa totals for 2017 77.70% 7,562
- Uses the same formulations described in the L-1 temporary work visas section.
O-1 "genius" visa
According to the Department of State, 17,011 visas were issued in the O-1 category, "Person with extraordinary ability in the sciences, art, education, business, or athletics". We have have omitted these counts because these individuals are required to provide proof that they are extraordinarily qualified.[9] Additionally, a large percentage of these recipients are likely to be celebrities, entertainers or professional athletes, the O-1 classification is not comparable to the H-1B visa.
United States educational assets
For this document, we examine three definitions of STEM related degree production for citizens and permanent residents.
- A listing of BLS occupational (6-digit) CIP definitions -- an average of 341,031 STEM bachelors degrees conferred per year.
- The DHS list of eligible OPT Extension (6-digit CIPs) -- an average of 349,213 STEM bachelors degrees conferred per year.
- The 2-digit Classification of Instructional Program (CIP) -- an average of 313,767 STEM bachelors degrees conferred per year.
Degree production -- BLS Definitions
From the BLS defined Occupations (SOC) and the related instructional programs (CIP) obtained from the NCES crosswalk. The table below is the first of 3 degree production data-sets. In this table we include Science, Engineering, Math & Computer and exclude Managers, Postsecondary Teachers and Sales.
A three year sample (2013-15) is averaged to determine degrees conferred to citizens and permanent residents. Degree production in this data-set falls between totals found in two other data-sets provided later in this document.
- Degree Production: Bachelors and above (per year) = 424,464
- Degree Production: Associate degree and above (per year) = 524,922
| BLS Defined: Science, Engineering, Math & Computer Degree Production by CIP Citizens and Permanent Residents | ||||||||||||||||||||
|---|---|---|---|---|---|---|---|---|---|---|---|---|---|---|---|---|---|---|---|---|
| NSF-NCES Degree Production (2013-2015) - Citizens and Permanent Residents | ||||||||||||||||||||
| Academic Discipline, 6-digit Classification of Instructional Program (CIP) | Doctorate Degrees | Masters Degrees | Bachelors Degrees | Associate Degrees | ||||||||||||||||
| 01.0106 Agricultural Business Technology | 58 | 83 | ||||||||||||||||||
| 01.0308 Agroecology and Sustainable Agriculture | 13 | 138 | 289 | 85 | ||||||||||||||||
| 01.0309 Viticulture and Enology | 28 | 371 | 236 | |||||||||||||||||
| 01.0701 International Agriculture | 104 | 131 | ||||||||||||||||||
| 01.0901 Animal Sciences, General | 255 | 1,004 | 15,445 | 425 | ||||||||||||||||
| 01.0902 Agricultural Animal Breeding | 6 | 13 | ||||||||||||||||||
| 01.0903 Animal Health | 5 | 3 | 17 | |||||||||||||||||
| 01.0904 Animal Nutrition | 8 | |||||||||||||||||||
| 01.0905 Dairy Science | 4 | 22 | 431 | 152 | ||||||||||||||||
| 01.0906 Livestock Management | 4 | 5 | 48 | |||||||||||||||||
| 01.0907 Poultry Science | 15 | 36 | 314 | 13 | ||||||||||||||||
| 01.0999 Animal Sciences, Other | 13 | 211 | 181 | |||||||||||||||||
| 01.1001 Food Science | 151 | 833 | 3,780 | 39 | ||||||||||||||||
| 01.1002 Food Technology and Processing | 4 | 22 | 23 | 29 | ||||||||||||||||
| 01.1101 Plant Sciences, General | 72 | 238 | 1,272 | 27 | ||||||||||||||||
| 01.1102 Agronomy and Crop Science | 134 | 479 | 1,761 | 107 | ||||||||||||||||
| 01.1103 Horticultural Science | 67 | 223 | 1,783 | 100 | ||||||||||||||||
| 01.1104 Agricultural and Horticultural Plant Breeding | 27 | 36 | 10 | 2 | ||||||||||||||||
| 01.1105 Plant Protection & Integrated Pest Management | 10 | 57 | 127 | 29 | ||||||||||||||||
| 01.1106 Range Science and Management | 16 | 100 | 416 | 28 | ||||||||||||||||
| 01.1199 Plant Sciences, Other | 42 | 115 | 120 | |||||||||||||||||
| 01.1201 Soil Science and Agronomy, General | 102 | 275 | 440 | 2 | ||||||||||||||||
| 01.1202 Soil Chemistry and Physics | 8 | 67 | ||||||||||||||||||
| 01.1299 Soil Sciences, Other | 11 | 35 | 112 | |||||||||||||||||
| 03.0101 Natural Resources/Conservation, General | 192 | 1,483 | 4,040 | 905 | ||||||||||||||||
| 03.0103 Environmental Studies | 201 | 2,497 | 17,486 | 584 | ||||||||||||||||
| 03.0104 Environmental Science | 385 | 2,726 | 16,101 | 586 | ||||||||||||||||
| 03.0201 Natural Resources Management and Policy | 78 | 1,262 | 1,749 | 198 | ||||||||||||||||
| 03.0205 Water, Wetlands, and Marine Resources Management | 3 | 368 | 266 | 76 | ||||||||||||||||
| 03.0206 Land Use Planning and Management/Development | 26 | 130 | 157 | 2 | ||||||||||||||||
| 03.0501 Forestry, General | 91 | 363 | 1,667 | 222 | ||||||||||||||||
| 03.0502 Forest Sciences and Biology | 168 | 333 | 542 | 1 | ||||||||||||||||
| 03.0506 Forest Management/ Forest Resources Management | 7 | 125 | 500 | 95 | ||||||||||||||||
| 03.0508 Urban Forestry | 8 | 25 | 40 | 94 | ||||||||||||||||
| 03.0509 Wood Science and Wood Products/Pulp and Paper Technology | 8 | 31 | 163 | 12 | ||||||||||||||||
| 03.0510 Forest Resources Production and Management | 11 | 43 | 17 | 2 | ||||||||||||||||
| 03.0511 Forestry Technology/Technician | 4 | 16 | 790 | |||||||||||||||||
| 03.0599 Forestry, Other | 8 | 30 | 135 | 12 | ||||||||||||||||
| 03.0601 Wildlife, Fish and Wildlands Science and Management | 114 | 428 | 4,233 | 612 | ||||||||||||||||
| 11.0101 Computer and Information Sciences, General | 743 | 6,199 | 36,080 | 13,364 | ||||||||||||||||
| 11.0102 Artificial Intelligence | 33 | 143 | ||||||||||||||||||
| 11.0103 Information Technology | 136 | 5,531 | 20,046 | 13,407 | ||||||||||||||||
| 11.0104 Informatics | 25 | 723 | 1,755 | 1 | ||||||||||||||||
| 11.0199 Computer Science, Other | 47 | 227 | 848 | 153 | ||||||||||||||||
| 11.0201 Computer Programming/Programmer, General | 5 | 148 | 3,877 | 8,233 | ||||||||||||||||
| 11.0202 Computer Programming Special Applications | 72 | 759 | 1,957 | |||||||||||||||||
| 11.0203 Computer Programming, Vendor/Product Certification | 19 | |||||||||||||||||||
| 11.0299 Computer Programming, Other | 93 | 36 | ||||||||||||||||||
| 11.0301 Data Processing and Data Processing Technology/Technician | 214 | 2,892 | ||||||||||||||||||
| 11.0401 Information Science/Studies | 346 | 9,296 | 17,371 | 2,973 | ||||||||||||||||
| 11.0501 Computer Systems Analysis/Analyst | 536 | 4,304 | 574 | |||||||||||||||||
| 11.0701 Computer Science | 1,212 | 7,665 | 37,151 | 3,443 | ||||||||||||||||
| 11.0801 Web Page, Digital/Multimedia and Information Resources Design | 539 | 4,812 | 6,615 | |||||||||||||||||
| 11.0802 Data Modeling/Warehousing and Database Administration | 327 | 534 | 456 | |||||||||||||||||
| 11.0803 Computer Graphics | 224 | 4,209 | 2,118 | |||||||||||||||||
| 11.0804 Modeling, Virtual Environments and Simulation | 1 | 104 | 669 | 36 | ||||||||||||||||
| 11.0901 Computer Systems Networking and Telecommunications | 3 | 1,186 | 5,567 | 23,910 | ||||||||||||||||
| 11.1001 Network and System Administration/Administrator | 100 | 2,021 | 7,089 | |||||||||||||||||
| 11.1002 System, Networking, and LAN/WAN Management/Manager | 57 | 611 | 11,309 | |||||||||||||||||
| 11.1003 Computer and Information Systems Security/Information Assurance | 50 | 4,868 | 13,037 | 3,631 | ||||||||||||||||
| 11.1004 Web/Multimedia Management and Webmaster | 15 | 1,187 | 1,633 | |||||||||||||||||
| 11.1005 Information Technology Project Management | 17 | 553 | 1,006 | 118 | ||||||||||||||||
| 11.1006 Computer Support Specialist | 98 | 3,771 | ||||||||||||||||||
| 12.0509 Culinary Science/Culinology | 98 | 48 | ||||||||||||||||||
| 14.0101 Engineering, General | 521 | 4,455 | 5,979 | 6,878 | ||||||||||||||||
| 14.0201 Aerospace, Aeronautical and Astronautical/Space Engineering | 571 | 2,953 | 10,085 | 3 | ||||||||||||||||
| 14.0301 Agricultural Engineering | 144 | 497 | 2,821 | 14 | ||||||||||||||||
| 14.0401 Architectural Engineering | 16 | 338 | 1,947 | 25 | ||||||||||||||||
| 14.0501 Bioengineering and Biomedical Engineering | 2,044 | 4,241 | 15,241 | 74 | ||||||||||||||||
| 14.0601 Ceramic Sciences and Engineering | 25 | 30 | 237 | |||||||||||||||||
| 14.0701 Chemical Engineering | 1,369 | 2,177 | 22,250 | 76 | ||||||||||||||||
| 14.0702 Chemical and Biomolecular Engineering | 20 | 49 | 349 | 1 | ||||||||||||||||
| 14.0799 Chemical Engineering, Other | 7 | |||||||||||||||||||
| 14.0901 Computer Engineering, General | 323 | 2,093 | 14,167 | 80 | ||||||||||||||||
| 14.0902 Computer Hardware Engineering | 87 | |||||||||||||||||||
| 14.0903 Computer Software Engineering | 10 | 1,810 | 1,842 | 58 | ||||||||||||||||
| 14.0999 Computer Engineering, Other | 4 | 24 | 131 | 66 | ||||||||||||||||
| 14.1001 Electrical and Electronics Engineering | 2,119 | 10,172 | 36,438 | 526 | ||||||||||||||||
| 14.1003 Laser and Optical Engineering | 24 | 50 | 38 | |||||||||||||||||
| 14.1004 Telecommunications Engineering | 104 | 6 | 70 | |||||||||||||||||
| 14.1099 Electrical, Electronics and Communications Engineering, Other | 14 | 67 | 215 | 2 | ||||||||||||||||
| 14.1101 Engineering Mechanics | 56 | 164 | 253 | 33 | ||||||||||||||||
| 14.1201 Engineering Physics/Applied Physics | 118 | 171 | 1,381 | 38 | ||||||||||||||||
| 14.1301 Engineering Science | 150 | 541 | 1,209 | 746 | ||||||||||||||||
| 14.1401 Environmental/Environmental Health Engineering | 242 | 1,685 | 3,666 | 46 | ||||||||||||||||
| 14.1801 Materials Engineering | 815 | 1,350 | 3,273 | 11 | ||||||||||||||||
| 14.1901 Mechanical Engineering | 1,884 | 11,413 | 68,984 | 512 | ||||||||||||||||
| 14.2001 Metallurgical Engineering | 21 | 70 | 320 | |||||||||||||||||
| 14.2101 Mining and Mineral Engineering | 23 | 110 | 785 | |||||||||||||||||
| 14.2201 Naval Architecture and Marine Engineering | 19 | 86 | 1,167 | 8 | ||||||||||||||||
| 14.2301 Nuclear Engineering | 290 | 818 | 1,607 | |||||||||||||||||
| 14.2401 Ocean Engineering | 21 | 169 | 534 | |||||||||||||||||
| 14.2501 Petroleum Engineering | 42 | 444 | 3,345 | 3 | ||||||||||||||||
| 14.2701 Systems Engineering | 201 | 4,579 | 2,203 | |||||||||||||||||
| 14.2801 Textile Sciences and Engineering | 25 | 65 | 709 | |||||||||||||||||
| 14.3201 Polymer/Plastics Engineering | 81 | 162 | 280 | |||||||||||||||||
| 14.3301 Construction Engineering | 204 | 1,198 | 14 | |||||||||||||||||
| 14.3401 Forest Engineering | 2 | 5 | 69 | |||||||||||||||||
| 14.3501 Industrial Engineering | 283 | 2,683 | 10,756 | 139 | ||||||||||||||||
| 14.3601 Manufacturing Engineering | 8 | 542 | 894 | 6 | ||||||||||||||||
| 14.3701 Operations Research | 45 | 560 | 979 | 13 | ||||||||||||||||
| 14.3801 Surveying Engineering | 1 | 24 | 96 | 30 | ||||||||||||||||
| 14.3901 Geological/Geophysical Engineering | 23 | 400 | 530 | |||||||||||||||||
| 14.4001 Paper Science and Engineering | 4 | 5 | 36 | 16 | ||||||||||||||||
| 14.4101 Electromechanical Engineering | 140 | |||||||||||||||||||
| 14.4201 Mechatronics, Robotics, and Automation Engineering | 22 | 107 | 77 | 58 | ||||||||||||||||
| 14.4301 Biochemical Engineering | 5 | 173 | ||||||||||||||||||
| 14.4401 Engineering Chemistry | 15 | |||||||||||||||||||
| 14.4501 Biological/Biosystems Engineering | 14 | 24 | 574 | |||||||||||||||||
| 14.9999 Engineering, Other | 192 | 2,503 | 2,146 | 153 | ||||||||||||||||
| 15.0101 Architectural Engineering Technology/Technician | 19 | 1,086 | 2,000 | |||||||||||||||||
| 15.0201 Civil Engineering Technology/Technician | 1,470 | 2,535 | ||||||||||||||||||
| 15.0303 Electrical, Electronic and Communications Engineering Technology/Technician | 49 | 5,248 | 22,021 | |||||||||||||||||
| 15.0304 Laser and Optical Technology/Technician | 221 | |||||||||||||||||||
| 15.0305 Telecommunications Technology/Technician | 65 | 259 | 924 | |||||||||||||||||
| 15.0399 Electrical and Electronic Engineering Technologies/Technicians, Other | 5 | 2,023 | 1,995 | |||||||||||||||||
| 15.0401 Biomedical Technology/Technician | 5 | 1 | 325 | 2,377 | ||||||||||||||||
| 15.0403 Electromechanical Technology/Electromechanical Engineering Technology | 11 | 236 | 2,148 | |||||||||||||||||
| 15.0404 Instrumentation Technology/Technician | 90 | 2,879 | ||||||||||||||||||
| 15.0405 Robotics Technology/Technician | 24 | 513 | ||||||||||||||||||
| 15.0406 Automation Engineer Technology/Technician | 137 | 619 | ||||||||||||||||||
| 15.0499 Electromechanical and Instrumentation and Maintenance Technologies/Technicians, Ot | 30 | 1,277 | ||||||||||||||||||
| 15.0501 Heating, Ventilation, Air Conditioning and Refrigeration Engineering Technology/Te | 7 | 3,367 | ||||||||||||||||||
| 15.0503 Energy Management and Systems Technology/Technician | 242 | 315 | 2,385 | |||||||||||||||||
| 15.0505 Solar Energy Technology/Technician | 27 | 175 | 298 | |||||||||||||||||
| 15.0507 Environmental Engineering Technology/Environmental Technology | 3 | 187 | 347 | 655 | ||||||||||||||||
| 15.0599 Environmental Control Technologies/Technicians, Other | 89 | 47 | 281 | |||||||||||||||||
| 15.0607 Plastics and Polymer Engineering Technology/Technician | 4 | 240 | 151 | |||||||||||||||||
| 15.0611 Metallurgical Technology/Technician | 140 | |||||||||||||||||||
| 15.0612 Industrial Technology/Technician | 36 | 537 | 4,855 | 4,068 | ||||||||||||||||
| 15.0613 Manufacturing Engineering Technology/Technician | 147 | 1,577 | 3,077 | |||||||||||||||||
| 15.0614 Welding Engineering Technology/Technician | 29 | 54 | ||||||||||||||||||
| 15.0615 Chemical Engineering Technology/Technician | 5 | |||||||||||||||||||
| 15.0616 Semiconductor Manufacturing Technology | 32 | |||||||||||||||||||
| 15.0699 Industrial Production Technologies/Technicians, Other | 9 | 841 | 3,145 | |||||||||||||||||
| 15.0801 Aeronautical/Aerospace Engineering Technology/Technician | 94 | 265 | 475 | |||||||||||||||||
| 15.0805 Mechanical Engineering/Mechanical Technology/Technician | 51 | 4,603 | 3,905 | |||||||||||||||||
| 15.0899 Mechanical Engineering Related Technologies/Technicians, Other | 546 | 291 | ||||||||||||||||||
| 15.0901 Mining Technology/Technician | 12 | 156 | ||||||||||||||||||
| 15.0903 Petroleum Technology/Technician | 67 | 1,193 | ||||||||||||||||||
| 15.0999 Mining and Petroleum Technologies/Technicians, Other | 16 | |||||||||||||||||||
| 15.1001 Construction Engineering Technology/Technician | 3 | 300 | 4,899 | 1,822 | ||||||||||||||||
| 15.1102 Survey Technology/ Surveying | 1 | 5 | 568 | 688 | ||||||||||||||||
| 15.1103 Hydraulics and Fluid Power Technology/ Technician | 11 | 146 | ||||||||||||||||||
| 15.1201 Computer Engineering Technology/ Technician | 1,383 | 2,189 | ||||||||||||||||||
| 15.1202 Computer Technology/Computer Systems Technology | 14 | 816 | 3,418 | |||||||||||||||||
| 15.1203 Computer Hardware Technology/Technician | 8 | |||||||||||||||||||
| 15.1301 Drafting and Design Technology/Technician, General | 204 | 8,306 | ||||||||||||||||||
| 15.1302 CAD/CADD Drafting and/or Design Technology/Technician | 1 | 12 | 271 | 4,602 | ||||||||||||||||
| 15.1303 Architectural Drafting and Architectural CAD/CADD | 4 | 2,215 | ||||||||||||||||||
| 15.1304 Civil Drafting and Civil Engineering CAD/CADD | 13 | 161 | ||||||||||||||||||
| 15.1305 Electrical/Electronics Drafting and Electrical/ Electronics CAD/CADD | 57 | |||||||||||||||||||
| 15.1306 Mechanical Drafting and Mechanical Drafting CAD/CADD | 101 | 1,640 | ||||||||||||||||||
| 15.1399 Drafting/Design Engineering Technologies/Technicians, Other | 26 | 143 | ||||||||||||||||||
| 15.1401 Nuclear Engineering Technology/Technician | 523 | 407 | ||||||||||||||||||
| 15.1501 Engineering/Industrial Management | 85 | 5,983 | 2,205 | 67 | ||||||||||||||||
| 15.1502 Engineering Design | 2 | 74 | 10 | |||||||||||||||||
| 15.1503 Packaging Science | 3 | 71 | 940 | |||||||||||||||||
| 15.1601 Nanotechnology | 6 | 27 | 17 | 105 | ||||||||||||||||
| 26.0101 Biology/Biological Sciences, General | 2,171 | 9,038 | 205,585 | 11,690 | ||||||||||||||||
| 26.0102 Biomedical Sciences, General | 1,039 | 4,142 | 8,719 | 155 | ||||||||||||||||
| 26.0202 Biochemistry | 1,039 | 691 | 20,742 | 3 | ||||||||||||||||
| 26.0203 Biophysics | 259 | 64 | 386 | |||||||||||||||||
| 26.0204 Molecular Biology | 490 | 596 | 2,111 | |||||||||||||||||
| 26.0205 Molecular Biochemistry | 131 | 125 | 1,167 | |||||||||||||||||
| 26.0206 Molecular Biophysics | 30 | 5 | ||||||||||||||||||
| 26.0207 Structural Biology | 14 | 3 | ||||||||||||||||||
| 26.0209 Radiation Biology/ Radiobiology | 17 | 26 | 25 | |||||||||||||||||
| 26.0210 Biochemistry and Molecular Biology | 352 | 173 | 2,105 | |||||||||||||||||
| 26.0301 Botany/Plant Biology | 213 | 215 | 592 | 1 | ||||||||||||||||
| 26.0305 Plant Pathology/Phytopathology | 108 | 147 | 38 | |||||||||||||||||
| 26.0307 Plant Physiology | 7 | 3 | ||||||||||||||||||
| 26.0308 Plant Molecular Biology | 16 | 2 | 1 | |||||||||||||||||
| 26.0399 Botany/Plant Biology, Other | 1 | 31 | 47 | |||||||||||||||||
| 26.0401 Cell/Cellular Biology and Histology | 292 | 54 | 1,153 | 148 | ||||||||||||||||
| 26.0403 Anatomy | 104 | 407 | 1,121 | |||||||||||||||||
| 26.0404 Developmental Biology and Embryology | 86 | 77 | 127 | |||||||||||||||||
| 26.0406 Cell/Cellular and Molecular Biology | 1,056 | 418 | 6,733 | |||||||||||||||||
| 26.0407 Cell Biology and Anatomy | 99 | 35 | 18 | |||||||||||||||||
| 26.0499 Cell/Cellular Biology and Anatomical Sciences, Other | 271 | 275 | 330 | 25 | ||||||||||||||||
| 26.0502 Microbiology, General | 507 | 454 | 5,776 | 8 | ||||||||||||||||
| 26.0503 Medical Microbiology and Bacteriology | 319 | 405 | 1,812 | |||||||||||||||||
| 26.0504 Virology | 37 | 1 | ||||||||||||||||||
| 26.0505 Parasitology | 1 | 6 | ||||||||||||||||||
| 26.0507 Immunology | 443 | 98 | ||||||||||||||||||
| 26.0508 Microbiology and Immunology | 207 | 59 | 317 | |||||||||||||||||
| 26.0701 Zoology/Animal Biology | 216 | 499 | 4,820 | 27 | ||||||||||||||||
| 26.0702 Entomology | 211 | 392 | 300 | |||||||||||||||||
| 26.0707 Animal Physiology | 56 | 185 | 205 | |||||||||||||||||
| 26.0708 Animal Behavior and Ethology | 14 | 33 | 209 | |||||||||||||||||
| 26.0709 Wildlife Biology | 12 | 39 | 1,130 | 27 | ||||||||||||||||
| 26.0801 Genetics, General | 289 | 124 | 730 | |||||||||||||||||
| 26.0802 Molecular Genetics | 148 | 50 | 521 | |||||||||||||||||
| 26.0804 Animal Genetics | 120 | 61 | 75 | |||||||||||||||||
| 26.0805 Plant Genetics | 19 | 10 | 12 | |||||||||||||||||
| 26.0806 Human/Medical Genetics | 193 | 281 | 2 | |||||||||||||||||
| 26.0807 Genome Sciences/Genomics | 14 | 4 | 5 | |||||||||||||||||
| 26.0899 Genetics, Other | 36 | 6 | ||||||||||||||||||
| 26.0901 Physiology, General | 343 | 1,521 | 4,523 | 2 | ||||||||||||||||
| 26.0902 Molecular Physiology | 53 | 19 | ||||||||||||||||||
| 26.0903 Cell Physiology | 53 | 42 | ||||||||||||||||||
| 26.0904 Endocrinology | 16 | 6 | ||||||||||||||||||
| 26.0905 Reproductive Biology | 3 | 19 | ||||||||||||||||||
| 26.0907 Cardiovascular Science | 10 | 17 | 101 | |||||||||||||||||
| 26.0908 Exercise Physiology | 149 | 716 | 7,401 | 28 | ||||||||||||||||
| 26.0909 Vision Science/Physiological Optics | 37 | 61 | 271 | |||||||||||||||||
| 26.0910 Pathology/Experimental Pathology | 441 | 217 | 81 | |||||||||||||||||
| 26.0911 Oncology and Cancer Biology | 250 | 77 | ||||||||||||||||||
| 26.0999 Physiology, Pathology, and Related Sciences, Other | 21 | 7 | ||||||||||||||||||
| 26.1001 Pharmacology | 521 | 328 | 147 | 2 | ||||||||||||||||
| 26.1002 Molecular Pharmacology | 87 | 10 | ||||||||||||||||||
| 26.1003 Neuropharmacology | 35 | |||||||||||||||||||
| 26.1004 Toxicology | 191 | 124 | 314 | |||||||||||||||||
| 26.1005 Molecular Toxicology | 8 | |||||||||||||||||||
| 26.1006 Environmental Toxicology | 57 | 114 | 101 | |||||||||||||||||
| 26.1007 Pharmacology and Toxicology | 98 | 143 | 189 | |||||||||||||||||
| 26.1101 Biometry/ Biometrics | 29 | 33 | 81 | |||||||||||||||||
| 26.1102 Biostatistics | 267 | 954 | 65 | |||||||||||||||||
| 26.1103 Bioinformatics | 181 | 505 | 400 | 26 | ||||||||||||||||
| 26.1104 Computational Biology | 64 | 21 | 82 | |||||||||||||||||
| 26.1199 Biomathematics, Bioinformatics, and Computational Biology, Other | 27 | 43 | 80 | |||||||||||||||||
| 26.1201 Biotechnology | 10 | 2,617 | 2,199 | 917 | ||||||||||||||||
| 26.1301 Ecology | 467 | 421 | 2,215 | 2 | ||||||||||||||||
| 26.1302 Marine Biology and Biological Oceanography | 147 | 641 | 3,684 | 92 | ||||||||||||||||
| 26.1303 Evolutionary Biology | 72 | 40 | 318 | |||||||||||||||||
| 26.1304 Aquatic Biology/Limnology | 38 | 254 | ||||||||||||||||||
| 26.1305 Environmental Biology | 18 | 117 | 778 | 14 | ||||||||||||||||
| 26.1306 Population Biology | 12 | 8 | ||||||||||||||||||
| 26.1307 Conservation Biology | 44 | 277 | 457 | |||||||||||||||||
| 26.1308 Systematic Biology/Biological Systematics | 16 | 3 | ||||||||||||||||||
| 26.1309 Epidemiology | 700 | 2,721 | 72 | |||||||||||||||||
| 26.1310 Ecology and Evolutionary Biology | 209 | 117 | 990 | |||||||||||||||||
| 26.1399 Ecology, Evolution, Systematics and Population Biology, Other | 84 | 69 | 427 | |||||||||||||||||
| 26.1401 Molecular Medicine | 99 | 33 | ||||||||||||||||||
| 26.1501 Neuroscience | 1,390 | 388 | 11,925 | |||||||||||||||||
| 26.1503 Neurobiology and Anatomy | 273 | 42 | 1,806 | |||||||||||||||||
| 26.1504 Neurobiology and Behavior | 40 | 83 | 228 | |||||||||||||||||
| 26.1599 Neurobiology and Neurosciences, Other | 8 | 17 | ||||||||||||||||||
| 26.9999 Biological and Biomedical Sciences, Other | 437 | 3,299 | 4,187 | 173 | ||||||||||||||||
| 27.0101 Mathematics, General | 1,841 | 6,235 | 46,345 | 6,296 | ||||||||||||||||
| 27.0102 Algebra and Number Theory | 14 | |||||||||||||||||||
| 27.0103 Analysis and Functional Analysis | 1 | |||||||||||||||||||
| 27.0105 Topology and Foundations | 5 | |||||||||||||||||||
| 27.0199 Mathematics, Other | 17 | 110 | 613 | 61 | ||||||||||||||||
| 27.0301 Applied Mathematics, General | 346 | 1,472 | 4,126 | |||||||||||||||||
| 27.0303 Computational Mathematics | 49 | 32 | 326 | |||||||||||||||||
| 27.0304 Computational and Applied Mathematics | 44 | 129 | 210 | |||||||||||||||||
| 27.0305 Financial Mathematics | 457 | 223 | ||||||||||||||||||
| 27.0306 Mathematical Biology | 45 | |||||||||||||||||||
| 27.0399 Applied Mathematics, Other | 22 | 103 | 312 | |||||||||||||||||
| 27.0501 Statistics, General | 400 | 2,937 | 2,882 | |||||||||||||||||
| 27.0502 Mathematical Statistics and Probability | 10 | 127 | 195 | |||||||||||||||||
| 27.0503 Mathematics and Statistics | 136 | 157 | ||||||||||||||||||
| 27.0599 Statistics, Other | 5 | 61 | 156 | 9 | ||||||||||||||||
| 27.9999 Mathematics and Statistics, Other | 21 | 77 | 494 | |||||||||||||||||
| 30.0801 Mathematics and Computer Science | 41 | 53 | 657 | 1 | ||||||||||||||||
| 30.1101 Gerontology | 71 | 1,306 | 904 | 107 | ||||||||||||||||
| 30.1601 Accounting and Computer Science | 22 | 14 | 86 | |||||||||||||||||
| 30.1701 Behavioral Sciences | 67 | 199 | 16,462 | 7,631 | ||||||||||||||||
| 30.1801 Natural Sciences | 16 | 272 | 2,244 | 1,286 | ||||||||||||||||
| 30.1901 Nutrition Sciences | 262 | 1,839 | 5,715 | 48 | ||||||||||||||||
| 30.2701 Human Biology | 2,058 | |||||||||||||||||||
| 30.3001 Computational Science | 13 | 70 | 49 | |||||||||||||||||
| 30.3101 Human Computer Interaction | 12 | 336 | 106 | |||||||||||||||||
| 30.3201 Marine Sciences | 33 | 141 | 208 | 4 | ||||||||||||||||
| 38.0102 Logic | 7 | 12 | 10 | |||||||||||||||||
| 40.0101 Physical Sciences | 36 | 98 | 1,146 | 8,321 | ||||||||||||||||
| 40.0201 Astronomy | 211 | 246 | 589 | 17 | ||||||||||||||||
| 40.0202 Astrophysics | 85 | 75 | 420 | |||||||||||||||||
| 40.0203 Planetary Astronomy and Science | 50 | 33 | 25 | |||||||||||||||||
| 40.0299 Astronomy and Astrophysics, Other | 23 | 24 | 89 | |||||||||||||||||
| 40.0401 Atmospheric Sciences and Meteorology, General | 227 | 539 | 1,543 | 1 | ||||||||||||||||
| 40.0403 Atmospheric Physics and Dynamics | 2 | 2 | ||||||||||||||||||
| 40.0404 Meteorology | 34 | 77 | 588 | |||||||||||||||||
| 40.0499 Atmospheric Sciences and Meteorology, Other | 12 | 6 | 59 | 12 | ||||||||||||||||
| 40.0501 Chemistry, General | 4,750 | 4,475 | 39,098 | 2,070 | ||||||||||||||||
| 40.0502 Analytical Chemistry | 16 | 42 | 28 | |||||||||||||||||
| 40.0503 Inorganic Chemistry | 3 | 1 | ||||||||||||||||||
| 40.0504 Organic Chemistry | 16 | 3 | ||||||||||||||||||
| 40.0506 Physical Chemistry | 31 | 1 | 6 | |||||||||||||||||
| 40.0507 Polymer Chemistry | 35 | 31 | 8 | |||||||||||||||||
| 40.0508 Chemical Physics | 29 | 6 | 77 | |||||||||||||||||
| 40.0509 Environmental Chemistry | 14 | 4 | 19 | |||||||||||||||||
| 40.0510 Forensic Chemistry | 197 | 6 | ||||||||||||||||||
| 40.0511 Theoretical Chemistry | 19 | |||||||||||||||||||
| 40.0599 Chemistry, Other | 82 | 96 | 1,660 | 17 | ||||||||||||||||
| 40.0601 Geology/Earth Science, General | 893 | 3,732 | 14,637 | 216 | ||||||||||||||||
| 40.0602 Geochemistry | 14 | 17 | 48 | |||||||||||||||||
| 40.0603 Geophysics and Seismology | 92 | 212 | 356 | |||||||||||||||||
| 40.0604 Paleontology | 9 | 8 | 3 | |||||||||||||||||
| 40.0605 Hydrology and Water Resources Science | 30 | 178 | 154 | 32 | ||||||||||||||||
| 40.0607 Oceanography, Chemical and Physical | 265 | 391 | 747 | 110 | ||||||||||||||||
| 40.0699 Geological and Earth Sciences/Geosciences, Other | 120 | 318 | 1,410 | 22 | ||||||||||||||||
| 40.0801 Physics, General | 2,683 | 3,361 | 17,120 | 1,505 | ||||||||||||||||
| 40.0802 Atomic/Molecular Physics | 8 | 20 | 3 | |||||||||||||||||
| 40.0804 Elementary Particle Physics | 1 | |||||||||||||||||||
| 40.0806 Nuclear Physics | 3 | 2 | 1 | |||||||||||||||||
| 40.0807 Optics/Optical Sciences | 86 | 158 | 95 | 75 | ||||||||||||||||
| 40.0808 Condensed Matter and Materials Physics | 9 | 2 | ||||||||||||||||||
| 40.0809 Acoustics | 13 | 37 | 62 | |||||||||||||||||
| 40.0810 Theoretical and Mathematical Physics | 32 | |||||||||||||||||||
| 40.0899 Physics, Other | 147 | 287 | 664 | |||||||||||||||||
| 40.1001 Materials Science | 209 | 262 | 387 | 17 | ||||||||||||||||
| 40.1002 Materials Chemistry | 13 | 30 | 20 | |||||||||||||||||
| 40.1099 Materials Sciences, Other | 2 | 1 | ||||||||||||||||||
| 40.9999 Physical Sciences, Other | 59 | 271 | 1,088 | 353 | ||||||||||||||||
| 41.0101 Biology Technician/Biotechnology Laboratory Technician | 6 | 85 | 1,247 | |||||||||||||||||
| 41.0204 Industrial Radiologic Technology/Technician | 177 | |||||||||||||||||||
| 41.0205 Nuclear/Nuclear Power Technology/Technician | 9 | 49 | 470 | |||||||||||||||||
| 41.0299 Nuclear and Industrial Radiologic Technologies/Technicians, Other | 2 | 3 | ||||||||||||||||||
| 41.0301 Chemical Technology/Technician | 1 | 21 | 2,828 | |||||||||||||||||
| 41.0303 Chemical Process Technology | 10 | |||||||||||||||||||
| 41.0399 Physical Science Technologies/Technicians, Other | 32 | |||||||||||||||||||
| 41.9999 Science Technologies/Technicians, Other | 94 | 1,377 | 2,379 | |||||||||||||||||
| 43.0106 Forensic Science and Technology | 1,818 | 3,542 | 1,385 | |||||||||||||||||
| 43.0116 Cyber/Computer Forensics and Counterterrorism | 271 | 505 | 229 | |||||||||||||||||
| 45.0101 Social Sciences, General | 59 | 1,636 | 24,177 | 34,118 | ||||||||||||||||
| 45.0102 Research Methodology and Quantitative Methods | 5 | 8 | ||||||||||||||||||
| 46.0415 Building Construction Technology | 165 | 705 | ||||||||||||||||||
| 51.0709 Medical Office Computer Specialist/Assistant | 119 | |||||||||||||||||||
| 51.0916 Radiation Protection/Health Physics Technician | 15 | 33 | 198 | |||||||||||||||||
| 51.1401 Medical Scientist | 57 | 1,175 | ||||||||||||||||||
| 51.2010 Pharmaceutical Sciences | 182 | 241 | 1,830 | 41 | ||||||||||||||||
| 51.2202 Environmental Health | 196 | 1,388 | 954 | 66 | ||||||||||||||||
| 51.2205 Health/ Medical Physics | 97 | 335 | 111 | 2 | ||||||||||||||||
| 51.2312 Assistive/Augmentative Technology and Rehabilitation Engineering | 31 | |||||||||||||||||||
| 51.2314 Rehabilitation Science | 101 | 177 | 1,722 | |||||||||||||||||
| 51.2706 Medical Informatics | 123 | 1,237 | 313 | 152 | ||||||||||||||||
| 52.1201 Management Information Systems, General | 114 | 7,923 | 21,813 | 3,035 | ||||||||||||||||
| 52.1302 Business Statistics | 179 | 266 | ||||||||||||||||||
| 52.1304 Actuarial Science | 334 | 2,349 | ||||||||||||||||||
| 3 Year total | 48,882 | 201,415 | 1,023,094 | 301,375 | ||||||||||||||||
| Average 2013-2015 | 16,294 | 67,138 | 341,031 | 100,458 | ||||||||||||||||
| Degree Production Bachelors and above (per year) = 424,464 | ||||||||||||||||||||
| Degree Production Associate degree and above (per year) = 524,922 | ||||||||||||||||||||
| Year: 2015, 2014, 2013 | ||||||||||||||||||||
| Citizenship (standardized): U.S. Citizens and Permanent Residents | ||||||||||||||||||||
Level of Degree or Other Award: Doctorate Degrees, Doctorate Degree-Research/Scholarship, Doctorate Degree-Professional Practice, Doctorate Degree-Other, First Professional Degrees, Master's Degrees, Bachelor's Degrees, Associate's Degrees
| ||||||||||||||||||||
OPT STEM Extension CIP list
The OPT STEM Extension, extends the OPT student work authorization from one year to three years for STEM related degree recipients from U.S. colleges.[10] Formally called the Cap Gap extension, the OPT extension was created to allow foreign STEM students to work while attempting to secure an H-1B visa over multiple years. While these foreign students are employed and awaiting adjustment of status (as an F-1 student), their labor is exempt from Social Security contributions, both personally and for the employer. This government subsidy, 12.4% on Social Security and 2.9% on Medicare, makes a non-citizen in STEM OPT status an extremely competitive job candidate.[11]
Federal training program sees 400% increase in foreign students graduating and working in STEM fields from 2008 to 2016
Between 2004 and 2016, the number of foreign student graduates who were approved for the OPT program rivaled the number of high-skilled workers initially approved for the nation’s largest temporary employment visa program, also known as the H-1B visa...[12]— NEIL G. RUIZ AND ABBY BUDIMAN,
Pew Research Center: "Number of Foreign College Students Staying and Working in U.S. After Graduation Surges"
Foreign student (F-1) employment authorization documents (EAD) are beyond the scope of this document, but included is the last three full years of available data.[13]
EADs by Classification and Basis for Eligibility,
Oct. 1, 2012 - June 29, 2017Approvals FY14* Approvals FY15* Approvals FY16** F-1 Pre-completion Optional Practical Training 3,584 3,955 3,351 F-1 Post Optional Practical Training 109,874 132,163 154,120 F-1 STEM students 21,977 28,083 45,184 F-1 International Org. 32 32 47 F-1 Severe Economic Hardship 681 903 1,033 Totals 136,148 165,136 203,735 * Numbers taken from FY16 USCIS Employment Authorization Documents Annual Report to Congress
** Numbers reported by USCIS Office of Performance and Quality
Our second gauge of US degree production comes from the DHS published CIPs, eligible for the STEM Extension.[14]
- The following is a table of the average 628,897 citizen and permanent resident yearly graduates who do not receive the OPT extension subsidy.
- From the DHS STEM designation list, 628,897 degrees are conferred annually, 113,653 associate degrees are included. Arguably, a three year, tax subsidized, internship would go a long way to enhancing the employability of these graduates.
DHS: STEM Designated Degree Program (CIP) List Effective May 10, 2016[14] NSF-NCES Degree Production (2013-2015) - Citizens and Permanent Residents Academic Discipline, 6-digit Classification of Instructional Program (CIP) Doctorate Degrees Masters Degrees Bachelors Degrees Associate Degrees 01.0308 Agroecology and Sustainable Agriculture 151 138 289 85 01.0901 Animal Sciences, General 1,259 1,004 15,445 425 01.0902 Agricultural Animal Breeding 19 13 01.0903 Animal Health 5 5 3 17 01.0904 Animal Nutrition 8 01.0905 Dairy Science 26 22 431 152 01.0906 Livestock Management 9 5 48 01.0907 Poultry Science 51 36 314 13 01.0999 Animal Sciences, Other 13 13 211 181 01.1001 Food Science 984 833 3,780 39 01.1002 Food Technology and Processing 26 22 23 29 01.1099 Food Science and Technology, Other 60 57 8 6 01.1101 Plant Sciences, General 310 238 1,272 27 01.1102 Agronomy and Crop Science 613 479 1,761 107 01.1103 Horticultural Science 290 223 1,783 100 01.1104 Agricultural and Horticultural Plant Breeding 63 36 10 2 01.1105 Plant Protection & Integrated Pest Management 67 57 127 29 01.1106 Range Science and Management 116 100 416 28 01.1199 Plant Sciences, Other 157 115 120 01.1201 Soil Science and Agronomy, General 377 275 440 2 01.1202 Soil Chemistry and Physics 8 8 67 01.1299 Soil Sciences, Other 46 35 112 03.0502 Forest Sciences and Biology 501 333 542 1 03.0508 Urban Forestry 33 25 40 94 03.0509 Wood Science and Wood Products/Pulp and Paper Technology 39 31 163 12 03.0601 Wildlife, Fish and Wildlands Science and Management 542 428 4,233 612 04.0902 Architectural and Building Sciences/Technology 247 237 317 24 09.0702 Digital Communication and Media/Multimedia 898 839 6,651 1,601 10.0304 Animation, Interactive Technology, Video Graphics and Special Effects 583 583 6,277 2,758 11.0101 Computer and Information Sciences, General 6,942 6,199 36,080 13,364 11.0102 Artificial Intelligence 176 143 11.0103 Information Technology 5,667 5,531 20,046 13,407 11.0104 Informatics 748 723 1,755 1 11.0199 Computer Science, Other 274 227 848 153 11.0201 Computer Programming/Programmer, General 153 148 3,877 8,233 11.0202 Computer Programming Special Applications 72 72 759 1,957 11.0203 Computer Programming, Vendor/Product Certification 19 11.0299 Computer Programming, Other 93 36 11.0301 Data Processing and Data Processing Technology/Technician 214 2,892 11.0401 Information Science/Studies 9,642 9,296 17,371 2,973 11.0501 Computer Systems Analysis/Analyst 536 536 4,304 574 11.0701 Computer Science 8,877 7,665 37,151 3,443 11.0801 Web Page, Digital/Multimedia and Information Resources Design 539 539 4,812 6,615 11.0802 Data Modeling/Warehousing and Database Administration 327 327 534 456 11.0803 Computer Graphics 224 224 4,209 2,118 11.0804 Modeling, Virtual Environments and Simulation 105 104 669 36 11.0899 Computer Software and Media Applications, Other 164 164 716 452 11.0901 Computer Systems Networking and Telecommunications 1,189 1,186 5,567 23,910 11.1001 Network and System Administration/Administrator 100 100 2,021 7,089 11.1002 System, Networking, and LAN/WAN Management/Manager 57 57 611 11,309 11.1003 Computer and Information Systems Security/Information Assurance 4,918 4,868 13,037 3,631 11.1004 Web/Multimedia Management and Webmaster 15 15 1,187 1,633 11.1005 Information Technology Project Management 570 553 1,006 118 11.1006 Computer Support Specialist 98 3,771 11.1099 Computer/Information Technology Services Administration and Management, Other 532 532 1,359 730 13.0501 Educational/Instructional Technology 12,866 12,460 113 237 13.0601 Educational Evaluation and Research 343 144 13.0603 Educational Statistics and Research Methods 149 89 14.0101 Engineering, General 4,976 4,455 5,979 6,878 14.0102 Pre-Engineering 49 2,424 14.0201 Aerospace, Aeronautical and Astronautical/Space Engineering 3,524 2,953 10,085 3 14.0301 Agricultural Engineering 641 497 2,821 14 14.0401 Architectural Engineering 354 338 1,947 25 14.0501 Bioengineering and Biomedical Engineering 6,285 4,241 15,241 74 14.0601 Ceramic Sciences and Engineering 55 30 237 14.0701 Chemical Engineering 3,546 2,177 22,250 76 14.0702 Chemical and Biomolecular Engineering 69 49 349 1 14.0799 Chemical Engineering, Other 7 7 14.0801 Civil Engineering, General 11,360 10,272 36,583 174 14.0802 Geotechnical and Geoenvironmental Engineering 2 2 14.0803 Structural Engineering 480 456 519 2 14.0804 Transportation and Highway Engineering 166 151 9 25 14.0805 Water Resources Engineering 190 165 26 13 14.0899 Civil Engineering, Other 46 45 44 18 14.0901 Computer Engineering, General 2,416 2,093 14,167 80 14.0902 Computer Hardware Engineering 87 87 14.0903 Computer Software Engineering 1,820 1,810 1,842 58 14.0999 Computer Engineering, Other 28 24 131 66 14.1001 Electrical and Electronics Engineering 12,291 10,172 36,438 526 14.1003 Laser and Optical Engineering 74 50 38 14.1004 Telecommunications Engineering 104 104 6 70 14.1099 Electrical, Electronics and Communications Engineering, Other 81 67 215 2 14.1101 Engineering Mechanics 220 164 253 33 14.1201 Engineering Physics/Applied Physics 289 171 1,381 38 14.1301 Engineering Science 691 541 1,209 746 14.1401 Environmental/Environmental Health Engineering 1,927 1,685 3,666 46 14.1801 Materials Engineering 2,165 1,350 3,273 11 14.1901 Mechanical Engineering 13,297 11,413 68,984 512 14.2001 Metallurgical Engineering 91 70 320 14.2101 Mining and Mineral Engineering 133 110 785 14.2201 Naval Architecture and Marine Engineering 105 86 1,167 8 14.2301 Nuclear Engineering 1,108 818 1,607 14.2401 Ocean Engineering 190 169 534 14.2501 Petroleum Engineering 486 444 3,345 3 14.2701 Systems Engineering 4,780 4,579 2,203 14.2801 Textile Sciences and Engineering 90 65 709 14.3201 Polymer/Plastics Engineering 243 162 280 14.3301 Construction Engineering 204 204 1,198 14 14.3401 Forest Engineering 7 5 69 14.3501 Industrial Engineering 2,966 2,683 10,756 139 14.3601 Manufacturing Engineering 550 542 894 6 14.3701 Operations Research 605 560 979 13 14.3801 Surveying Engineering 25 24 96 30 14.3901 Geological/Geophysical Engineering 423 400 530 14.4001 Paper Science and Engineering 9 5 36 16 14.4101 Electromechanical Engineering 140 14.4201 Mechatronics, Robotics, and Automation Engineering 129 107 77 58 14.4301 Biochemical Engineering 5 5 173 14.4401 Engineering Chemistry 15 14.4501 Biological/Biosystems Engineering 38 24 574 14.9999 Engineering, Other 2,695 2,503 2,146 153 15.0101 Architectural Engineering Technology/Technician 19 19 1,086 2,000 15.0201 Civil Engineering Technology/Technician 1,470 2,535 15.0303 Electrical, Electronic and Communications Engineering Technology/Technician 49 49 5,248 22,021 15.0304 Laser and Optical Technology/Technician 221 15.0305 Telecommunications Technology/Technician 65 65 259 924 15.0399 Electrical and Electronic Engineering Technologies/Technicians, Other 5 5 2,023 1,995 15.0401 Biomedical Technology/Technician 6 1 325 2,377 15.0403 Electromechanical Technology/Electromechanical Engineering Technology 11 11 236 2,148 15.0404 Instrumentation Technology/Technician 90 2,879 15.0405 Robotics Technology/Technician 24 513 15.0406 Automation Engineer Technology/Technician 137 619 15.0499 Electromechanical and Instrumentation and Maintenance Technologies/Technicians, Ot 30 1,277 15.0501 Heating, Ventilation, Air Conditioning and Refrigeration Engineering Technology/Te 7 3,367 15.0503 Energy Management and Systems Technology/Technician 242 242 315 2,385 15.0505 Solar Energy Technology/Technician 27 27 175 298 15.0506 Water Quality and Wastewater Treatment Management and Recycling Technology/Technic 43 835 15.0507 Environmental Engineering Technology/Environmental Technology 190 187 347 655 15.0508 Hazardous Materials Management and WasteTechnology/Technician 160 15.0599 Environmental Control Technologies/Technicians, Other 89 89 47 281 15.0607 Plastics and Polymer Engineering Technology/Technician 4 4 240 151 15.0611 Metallurgical Technology/Technician 140 15.0612 Industrial Technology/Technician 573 537 4,855 4,068 15.0613 Manufacturing Engineering Technology/Technician 147 147 1,577 3,077 15.0614 Welding Engineering Technology/Technician 29 54 15.0615 Chemical Engineering Technology/Technician 5 15.0616 Semiconductor Manufacturing Technology 32 15.0699 Industrial Production Technologies/Technicians, Other 9 9 841 3,145 15.0701 Occupational Safety and Health Technology/Technician 1,397 1,397 3,795 2,136 15.0702 Quality Control Technology/Technician 304 304 52 309 15.0703 Industrial Safety Technology/Technician 70 70 293 98 15.0799 Quality Control and Safety Technologies/Technicians, Other 6 6 140 23 15.0801 Aeronautical/Aerospace Engineering Technology/Technician 94 94 265 475 15.0803 Automotive Engineering Technology/Technician 11 11 794 1,269 15.0805 Mechanical Engineering/Mechanical Technology/Technician 51 51 4,603 3,905 15.0899 Mechanical Engineering Related Technologies/Technicians, Other 546 291 15.0901 Mining Technology/Technician 12 156 15.0903 Petroleum Technology/Technician 67 1,193 15.0999 Mining and Petroleum Technologies/Technicians, Other 16 15.1001 Construction Engineering Technology/Technician 303 300 4,899 1,822 15.1102 Survey Technology/ Surveying 6 5 568 688 15.1103 Hydraulics and Fluid Power Technology/ Technician 11 146 15.1199 Engineering-Related Technologies, Other 57 15.1201 Computer Engineering Technology/ Technician 1,383 2,189 15.1202 Computer Technology/Computer Systems Technology 14 14 816 3,418 15.1203 Computer Hardware Technology/Technician 8 15.1204 Computer Software Technology/Technician 114 169 15.1299 Computer Engineering Technologies/Technicians, Other 78 89 15.1301 Drafting and Design Technology/Technician, General 204 8,306 15.1302 CAD/CADD Drafting and/or Design Technology/Technician 13 12 271 4,602 15.1303 Architectural Drafting and Architectural CAD/CADD 4 2,215 15.1304 Civil Drafting and Civil Engineering CAD/CADD 13 161 15.1305 Electrical/Electronics Drafting and Electrical/ Electronics CAD/CADD 57 15.1306 Mechanical Drafting and Mechanical Drafting CAD/CADD 101 1,640 15.1399 Drafting/Design Engineering Technologies/Technicians, Other 26 143 15.1401 Nuclear Engineering Technology/Technician 523 407 15.1501 Engineering/Industrial Management 6,068 5,983 2,205 67 15.1502 Engineering Design 76 74 10 15.1503 Packaging Science 74 71 940 15.1599 Engineering-Related Fields, Other 41 20 68 4 15.1601 Nanotechnology 33 27 17 105 15.9999 Engineering Technologies and Engineering-Related Fields, Other 773 759 5,509 4,738 26.0101 Biology/Biological Sciences, General 11,209 9,038 205,585 11,690 26.0102 Biomedical Sciences, General 5,181 4,142 8,719 155 26.0202 Biochemistry 1,730 691 20,742 3 26.0203 Biophysics 323 64 386 26.0204 Molecular Biology 1,086 596 2,111 26.0205 Molecular Biochemistry 256 125 1,167 26.0206 Molecular Biophysics 35 5 26.0207 Structural Biology 17 3 26.0209 Radiation Biology/ Radiobiology 43 26 25 26.0210 Biochemistry and Molecular Biology 525 173 2,105 26.0299 Biochemistry, Biophysics and Molecular Biology, Other 72 21 574 26.0301 Botany/Plant Biology 428 215 592 1 26.0305 Plant Pathology/Phytopathology 255 147 38 26.0307 Plant Physiology 10 3 26.0308 Plant Molecular Biology 18 2 1 26.0399 Botany/Plant Biology, Other 32 31 47 26.0401 Cell/Cellular Biology and Histology 346 54 1,153 148 26.0403 Anatomy 511 407 1,121 26.0404 Developmental Biology and Embryology 163 77 127 26.0406 Cell/Cellular and Molecular Biology 1,474 418 6,733 26.0407 Cell Biology and Anatomy 134 35 18 26.0499 Cell/Cellular Biology and Anatomical Sciences, Other 546 275 330 25 26.0502 Microbiology, General 961 454 5,776 8 26.0503 Medical Microbiology and Bacteriology 724 405 1,812 26.0504 Virology 38 1 26.0505 Parasitology 7 6 26.0507 Immunology 541 98 26.0508 Microbiology and Immunology 266 59 317 26.0599 Microbiological Sciences and Immunology, Other 270 105 373 26.0701 Zoology/Animal Biology 715 499 4,820 27 26.0702 Entomology 603 392 300 26.0707 Animal Physiology 241 185 205 26.0708 Animal Behavior and Ethology 47 33 209 26.0709 Wildlife Biology 51 39 1,130 27 26.0799 Zoology/Animal Biology, Other 60 55 59 5 26.0801 Genetics, General 413 124 730 26.0802 Molecular Genetics 198 50 521 26.0804 Animal Genetics 181 61 75 26.0805 Plant Genetics 29 10 12 26.0806 Human/Medical Genetics 474 281 2 26.0807 Genome Sciences/Genomics 18 4 5 26.0899 Genetics, Other 42 6 26.0901 Physiology, General 1,864 1,521 4,523 2 26.0902 Molecular Physiology 72 19 26.0903 Cell Physiology 95 42 26.0904 Endocrinology 22 6 26.0905 Reproductive Biology 22 19 26.0907 Cardiovascular Science 27 17 101 26.0908 Exercise Physiology 865 716 7,401 28 26.0909 Vision Science/Physiological Optics 98 61 271 26.0910 Pathology/Experimental Pathology 658 217 81 26.0911 Oncology and Cancer Biology 327 77 26.0999 Physiology, Pathology, and Related Sciences, Other 28 7 26.1001 Pharmacology 849 328 147 2 26.1002 Molecular Pharmacology 97 10 26.1003 Neuropharmacology 35 35 26.1004 Toxicology 315 124 314 26.1005 Molecular Toxicology 8 26.1006 Environmental Toxicology 171 114 101 26.1007 Pharmacology and Toxicology 241 143 189 26.1101 Biometry/ Biometrics 62 33 81 26.1102 Biostatistics 1,221 954 65 26.1103 Bioinformatics 686 505 400 26 26.1104 Computational Biology 85 21 82 26.1199 Biomathematics, Bioinformatics, and Computational Biology, Other 70 43 80 26.1201 Biotechnology 2,627 2,617 2,199 917 26.1301 Ecology 888 421 2,215 2 26.1302 Marine Biology and Biological Oceanography 788 641 3,684 92 26.1303 Evolutionary Biology 112 40 318 26.1304 Aquatic Biology/Limnology 38 38 254 26.1305 Environmental Biology 135 117 778 14 26.1306 Population Biology 20 8 26.1307 Conservation Biology 321 277 457 26.1308 Systematic Biology/Biological Systematics 19 3 26.1309 Epidemiology 3,421 2,721 72 26.1310 Ecology and Evolutionary Biology 326 117 990 26.1399 Ecology, Evolution, Systematics and Population Biology, Other 153 69 427 26.1401 Molecular Medicine 132 33 26.1501 Neuroscience 1,778 388 11,925 26.1503 Neurobiology and Anatomy 315 42 1,806 26.1504 Neurobiology and Behavior 123 83 228 26.1599 Neurobiology and Neurosciences, Other 8 17 26.9999 Biological and Biomedical Sciences, Other 3,736 3,299 4,187 173 27.0101 Mathematics, General 8,076 6,235 46,345 6,296 27.0102 Algebra and Number Theory 14 27.0103 Analysis and Functional Analysis 1 27.0105 Topology and Foundations 5 27.0199 Mathematics, Other 127 110 613 61 27.0301 Applied Mathematics, General 1,818 1,472 4,126 27.0303 Computational Mathematics 81 32 326 27.0304 Computational and Applied Mathematics 173 129 210 27.0305 Financial Mathematics 457 457 223 27.0306 Mathematical Biology 45 27.0399 Applied Mathematics, Other 125 103 312 27.0501 Statistics, General 3,337 2,937 2,882 27.0502 Mathematical Statistics and Probability 137 127 195 27.0503 Mathematics and Statistics 136 136 157 27.0599 Statistics, Other 66 61 156 9 27.9999 Mathematics and Statistics, Other 98 77 494 29.0201 Intelligence, General 33 33 249 2,367 29.0202 Strategic Intelligence 77 77 29.0203 Signal/Geospatial Intelligence 28 29.0207 Cyber/Electronic Operations and Warfare 3 3 29.0299 Intelligence, Command Control and Information Operations, Other 10 10 10 29.0399 Military Applied Sciences, Other 2 2 161 368 29.0402 Air and Space Operations Technology 164 29.0404 Explosive Ordinance/Bomb Disposal 33 29.0408 Munitions Systems/Ordinance Technology 4 29.9999 Military Technologies and Applied Sciences, Other 1 1 147 341 30.0101 Biological and Physical Sciences 1,169 1,056 6,523 57,833 30.0601 Systems Science and Theory 668 630 717 30.0801 Mathematics and Computer Science 94 53 657 1 30.1001 Biopsychology 25 13 514 30.1701 Behavioral Sciences 266 199 16,462 7,631 30.1801 Natural Sciences 288 272 2,244 1,286 30.1901 Nutrition Sciences 2,101 1,839 5,715 48 30.2501 Cognitive Science 253 175 2,488 30.3001 Computational Science 83 70 49 30.3101 Human Computer Interaction 348 336 106 30.3201 Marine Sciences 174 141 208 4 30.3301 Sustainability Studies 837 829 830 55 40.0101 Physical Sciences 134 98 1,146 8,321 40.0201 Astronomy 457 246 589 17 40.0202 Astrophysics 160 75 420 40.0203 Planetary Astronomy and Science 83 33 25 40.0299 Astronomy and Astrophysics, Other 47 24 89 40.0401 Atmospheric Sciences and Meteorology, General 766 539 1,543 1 40.0403 Atmospheric Physics and Dynamics 4 2 40.0404 Meteorology 111 77 588 40.0499 Atmospheric Sciences and Meteorology, Other 18 6 59 12 40.0501 Chemistry, General 9,225 4,475 39,098 2,070 40.0502 Analytical Chemistry 58 42 28 40.0503 Inorganic Chemistry 4 1 40.0504 Organic Chemistry 19 3 40.0506 Physical Chemistry 32 1 6 40.0507 Polymer Chemistry 66 31 8 40.0508 Chemical Physics 35 6 77 40.0509 Environmental Chemistry 18 4 19 40.0510 Forensic Chemistry 197 6 40.0511 Theoretical Chemistry 19 40.0599 Chemistry, Other 178 96 1,660 17 40.0601 Geology/Earth Science, General 4,625 3,732 14,637 216 40.0602 Geochemistry 31 17 48 40.0603 Geophysics and Seismology 304 212 356 40.0604 Paleontology 9 9 8 3 40.0605 Hydrology and Water Resources Science 208 178 154 32 40.0607 Oceanography, Chemical and Physical 656 391 747 110 40.0699 Geological and Earth Sciences/Geosciences, Other 438 318 1,410 22 40.0801 Physics, General 6,044 3,361 17,120 1,505 40.0802 Atomic/Molecular Physics 28 20 3 40.0804 Elementary Particle Physics 1 1 40.0806 Nuclear Physics 5 2 1 40.0807 Optics/Optical Sciences 244 158 95 75 40.0808 Condensed Matter and Materials Physics 11 2 40.0809 Acoustics 50 37 62 40.0810 Theoretical and Mathematical Physics 32 40.0899 Physics, Other 434 287 664 40.1001 Materials Science 471 262 387 17 40.1002 Materials Chemistry 43 30 20 40.1099 Materials Sciences, Other 3 1 40.9999 Physical Sciences, Other 330 271 1,088 353 41.0101 Biology Technician/Biotechnology Laboratory Technician 6 85 1,247 41.0204 Industrial Radiologic Technology/Technician 177 41.0205 Nuclear/Nuclear Power Technology/Technician 9 9 49 470 41.0299 Nuclear and Industrial Radiologic Technologies/Technicians, Other 2 3 41.0301 Chemical Technology/Technician 1 1 21 2,828 41.0303 Chemical Process Technology 10 41.0399 Physical Science Technologies/Technicians, Other 32 41.9999 Science Technologies/Technicians, Other 94 94 1,377 2,379 42.2701 Cognitive Psychology and Psycholinguistics 35 17 247 42.2702 Comparative Psychology 25 25 42.2703 Developmental and Child Psychology 996 869 1,965 15 42.2704 Experimental Psychology 802 487 2,920 42.2705 Personality Psychology 38 19 48 42.2706 Physiological Psychology/Psychobiology 97 73 3,233 42.2707 Social Psychologyr 354 229 2,961 59 42.2708 Psychometrics and Quantitative Psychology 67 38 2 42.2709 Psychopharmacology 114 114 42.2799 Research and Experimental Psychology, Other 165 45 2,668 43.0106 Forensic Science and Technology 1,818 1,818 3,542 1,385 43.0116 Cyber/Computer Forensics and Counterterrorism 271 271 505 229 45.0301 Archeology 200 156 649 23 45.0603 Econometrics and Quantitative Economics 118 107 1,544 45.0702 Geographic Information Science and Cartography 883 868 822 260 49.0101 Aeronautics/Aviation/Aerospace Science and Technology, General 1,699 1,690 6,836 1,408 51.1002 Cytotechnology/Cytotechnologist 31 31 171 1 51.1005 Clinical Laboratory Science/Medical Technology/Technologist 499 499 8,011 286 51.1401 Medical Scientist 1,232 1,175 51.2003 Pharmaceutics and Drug Design 438 212 438 51.2004 Medicinal and Pharmaceutical Chemistry 282 115 63 51.2005 Natural Products Chemistry and Pharmacognosy 6 3 51.2006 Clinical and Industrial Drug Development 344 344 102 51.2007 Pharmacoeconomics/Pharmaceutical Economics 305 2 51.2009 Industrial and Physical Pharmacy and Cosmetic Sciences 37 37 4 51.2010 Pharmaceutical Sciences 423 241 1,830 41 51.2202 Environmental Health 1,584 1,388 954 66 51.2205 Health/ Medical Physics 432 335 111 2 51.2503 Veterinary Physiology 6 51.2504 Veterinary Microbiology and Immunobiology 17 9 80 51.2505 Veterinary Pathology and Pathobiology 46 9 51.2510 Veterinary Preventive Medicine, Epidemiology, and Public Health 24 24 51.2511 Veterinary Infectious Diseases 10 51.2706 Medical Informatics 1,360 1,237 313 152 52.1301 Management Science 3,589 3,561 8,404 180 52.1302 Business Statistics 179 179 266 52.1304 Actuarial Science 334 334 2,349 52.1399 Management Sciences and Quantitative Methods, Other 762 751 879 01.0308 Agroecology and Sustainable Agriculture 29 18 1 3 Year total 274,839 223,254 1,047,638 340,959 1 Year Average By Academic Level 91,613 74,418 349,213 113,653 Average 1 Year Degree Production = 628,897 Year: 2015, 2014, 2013[2] Academic Discipline, 6-digit Classification of Instructional Program (CIP) Level of Degree or Other Award: Doctorate Degrees, Doctorate Degree-Research/Scholarship, Doctorate Degree-Professional Practice, Doctorate Degree-Other, First Professional Degrees, Master's Degrees, Bachelor's Degrees, Associate's Degrees Citizenship (standardized): U.S. Citizens and Permanent Residents
NCES STEM degree production
Provided is National Science Foundation published (NCES colleges) graduation statistic in STEM related curriculums, these exclude temporary residents. The following is the latest 3 years of data available from the National Science Foundation's, WebCASPAR website.[2]
NCES Level of Degree or Other Award, Citizens and Permanent Residents Doctorate degrees Masters degrees Bachelors degrees Associate degrees Year Academic Discipline
2-digit Classification of Instructional Program (CIP)2013 04 Architecture and Related Services 157 6,679 9,211 458 11 Computer and Information Sciences and Support Services 870 12,725 49,204 38,608 14 Engineering 4,031 23,263 80,300 3,599 15 Engineering Technologies and Engineering Related Fields 57 3,545 16,122 34,248 25 Library Science 34 6,928 102 193 26 Biological and Biomedical Sciences 5,838 11,257 98,844 4,112 27 Mathematics and Statistics 912 4,002 18,412 1,733 40 Physical Sciences 3,337 5,049 26,417 3,851 41 Science Technologies/Technicians 2 32 563 2,264 2014 04 Architecture and Related Services 135 6,240 8,557 400 11 Computer and Information Sciences and Support Services 922 13,409 53,311 37,312 14 Engineering 4,380 23,308 85,681 4,094 15 Engineering Technologies and Engineering Related Fields 53 3,504 15,731 32,293 25 Library Science 37 5,771 127 196 26 Biological and Biomedical Sciences 6,072 11,780 103,543 4,475 27 Mathematics and Statistics 948 3,927 18,605 2,045 40 Physical Sciences 3,413 4,986 27,679 4,235 41 Science Technologies/Technicians 1 30 489 2,382 2015 04 Architecture and Related Services 160 6,020 8,421 470 11 Computer and Information Sciences and Support Services 912 14,199 56,940 36,097 14 Engineering 4,528 22,563 90,394 4,662 15 Engineering Technologies and Engineering Related Fields 70 3,541 15,868 32,533 25 Library Science 37 5,190 99 175 26 Biological and Biomedical Sciences 5,880 12,304 108,825 4,859 27 Mathematics and Statistics 900 3,947 19,068 2,602 40 Physical Sciences 3,552 5,013 28,307 4,691 41 Science Technologies/Technicians 3 42 482 2,500 Subtotals 47,241 219,254 941,302 265,087 Yearly average by degree 15,747 73,085 313,767 88,362 Yearly average STEM degree production (Citizens and Permanent residents) = 490,961 Year: 2015, 2014, 2013[2] Academic Discipline, 2-digit Classification of Instructional Program (CIP): 04 Architecture and Related Services, 11 Computer and Information Sciences and Support Services, 14 Engineering, 15 Engineering Technologies and Engineering Related Fields, 25 Library Science, 26 Biological and Biomedical Sciences, 27 Mathematics and Statistics, 40 Physical Sciences, 41 Science Technologies/Technicians Level of Degree or Other Award: Doctorate Degrees, Doctorate Degree-Research/Scholarship, Doctorate Degree-Professional Practice, Doctorate Degree-Other, First Professional Degrees, Master's Degrees, Bachelor's Degrees, Associate's Degrees Citizenship (standardized): U.S. Citizens and Permanent Residents
Conclusion
In conclusion, we don't feel it is wise national policy to dedicate 100% or more of our STEM employment growth to temporary foreign workers.
- Using the exact CIPs derived from the BLS STEM occupations list, average degree production (524,922 yr.), exceeded four times the STEM employment growth for 2017.
- Using the DHS OPT definition of STEM CIPs, used for temporary immigration purposes, average degree production (628,897 yr.) exceeds 5 times the amount of 2017 STEM employment growth in 2017.
- Using the more traditional 2-digit Classification for known STEM CIP groupings, the average degrees conferred (490,961 yr.), exceeded four times the 2017 employment growth.
STEM Employment Opportunity Breakdown for US Workers
(Of the STEM employment growth of 118,740 in 2017)[1]H-1B visa employment share 86,030 72.45% L-1 visa employment share 36,677 30.89% NAFTA visa employment share 7,562 6.37% Total temporary employment visa share 130,269 109.71% US STEM employment share = -11,529
There are several glaring policy questions that come to mind.
- What percentage of an occupation's annual employment growth should be dedicated to temporary foreign workers?
- During recessions, occupational employment levels often go negative, but temporary foreign work visas continue to be awarded to those occupations. Is this fair to United States college students graduating into recession?
- During recession recoveries, should there be a moratorium on temporary foreign work visas, so that citizens and permanent residents are included in the recovery?
- On April 7, 2017, USCIS announced that they had received 199,000 H-1B petitions during the filing period, "including petitions filed for the advanced degree exemption." [15] With a cap of 85,000, on May 3, 2017, USCIS announced, " USCIS will now begin returning all H-1B cap-subject petitions that were not selected." [16] Bloomberg reports that filing fees of $4000.00 are returned with these 114,000 rejected petitions.[17] Of this $465 million in unrealized revenue, a $500.00 Fraud Prevention fee and a $750.00 to $1500.00 ACWIA retraining fee go uncollected.[18] How does USCIS justify depriving US citizens and permanent residents, from these hundreds of millions of dollars worth of protections and retraining funds annually?
Further reading
- "Yoder’s Green-Card Giveaway Will Expand Bias Against U.S. College-Grads, Say American Professionals", by Neil Munro, August 16, 2018.
Epilogue
Review by Neil Munro
- Great page, but we need to subtract the H-1Bs/L-1s who leave. (Many stay in the EB-line, & 70K get GCs). I'd guess this data shows that most entry-level STEM jobs go to visa-workers & EB-GCs. Many entry-level accounting/biz/healthcare degrees go to visa-workers.
- @NeilMunroDC
- 6:16 PM - 27 Sep 2018[1]
- The government does not provide departure data, but over 90% of H-1B are renewed for a second three year term. This report is primarily concerned with one year, 2017.
- The "EB-Line" (Employment based permanent residence), is not an adjustment of status, it is an extension (AC21) of the H-1B or L-1 that allows the non-immigrant to extend beyond the initial six year limitation. Technically, these are still H-1B and L-1 visa holders.
- If most entry level STEM jobs go to visa workers, then we are conferring over 300,000 worthless STEM bachelor's degrees per year to citizens and permanent residents.
- This report focuses on 2017, initial employment approvals for H-1B 77.7% (86,030). Other mentioned occupational classifications for 2017:
- Administrative Specializations = 6.2% (6,711)
- Medicine and Health = 4.4% (4,696)
- Managers and Officials N.E.C.* = 1.3% (1,398)
- This report purposely excluded the OPT extension, aka "H-1B Cap Gap" for foreign STEM students. In addition to the 130,269 H-1B, L-1 and NAFTA workers added in 2017 (110% of employment growth), an additional 45,184 (2016) foreign students entered the U.S. STEM workforce for up to 3 years.
Finally, if we take into consideration that there are 1.5 million Indian nationals backlogged in our employment based green card system since 2004,[19] departures and retirements are not likely to represent a significant portion of these presumably entry level positions.
References
- ↑ 1.0 1.1 1.2 1.3 1.4 "Occupational Employment Statistics: STEM data sets".
- ↑ 2.0 2.1 2.2 2.3 "WebCASPAR: Integrated Science and Enginering Resources Data System".
- ↑ "SOC 2010 to CIP 2010 Crosswalk".
- ↑ "Characteristics of H-1B Specialty Occupation Workers, Fiscal Year 2017 Annual Report to Congress, October 1, 2016 – September 30, 2017, April 9, 2018" (PDF).
- ↑ "L-1A Intracompany Transferee Executive or Manager".
- ↑ 7.0 7.1 "Table XVI(B) Nonimmigrant Visas Issued by Classification (Including Border Crossing Cards) Fiscal Years 2013-2017" (PDF).
- ↑ "TN NAFTA Professionals".
- ↑ "O-1 Visa: Individuals with Extraordinary Ability or Achievement".
- ↑ "STEM OPT Extension Overview".
- ↑ John Miano. "Immigration Reforms Needed to Protect Skilled American Workers". Center for Immigration Studies. Retrieved 2015-03-17.
- ↑ "Number of Foreign College Students Staying and Working in U.S. After Graduation Surges". Pew Research Center's Global Attitudes Project. 2018-05-10. Retrieved 2018-05-10.
- ↑ "Did you know that USCIS receives and adjudicates approximately 6 million petitions and applications annually?". USCIS. 2018-03-31. Retrieved 2018-05-12.
- ↑ 14.0 14.1 "DHS: STEM Designated Degree Program List Effective May 10, 2016" (PDF).
- ↑ "USCIS Completes the H-1B Cap Random Selection Process for FY 2018". USCIS. 2017-04-07. Archived from the original on 2018-05-09. Retrieved 2018-05-09.
- ↑ "USCIS Completes Data Entry of Fiscal Year 2018 H-1B Cap Subject Petitions". USCIS. 2017-05-03. Archived from the original on 2018-05-09. Retrieved 2018-05-09. Cite has empty unknown parameter:
|1=(help) - ↑ Francis, Laura D. (2016-03-21). "So You've Lost the H-1B Lottery: Now What?". Legal, Tax, EHS, and HR Expert Information & Analysis. Archived from the original on 2018-05-09. Retrieved 2018-05-09.
- ↑ "H and L Filing Fees for Form I-129, Petition for a Nonimmigrant Worker". USCIS. 2015-12-18. Archived from the original on 2018-05-09. Retrieved 2018-05-09.
- ↑ Munro, Neil (2018-09-13). "Rep. Yoder's India Lobby Offers $$$ to Jump Line for Green Cards". Breitbart. Retrieved 2018-10-04.